Chapter 2Basic Principles of NMR
In this chapter we give a brief introduction to the principles of nuclear magnetic resonance (NMR), and a survey of using NMR for studies of structures and dynamics of proteins and nucleic acids.
While some of the basic concepts were introduced in chapter 1, we must now develop a deeper understanding for the physics and geometry of the experimental measurements. The foundation we build in chapters 2 and 3 will be expanded by the algorithms in later chapters.
Overview of NMR
NMR is a physical experiment that measures the electronic properties of each nucleus in a magnetic field by exploiting the spin properties of an atom’s nucleus. All nuclei containing an odd number of neutrons and some that contain an even number of neutrons but odd charge have an intrinsic magnetic moment. NMR works by applying a strong magnetic field (the stronger the field, the higher the resolution) to a sample and then measuring how the system responds to radio-frequency waves. The radio-frequency wave is electromagnetic radiation with an appropriate frequency that can be absorbed by a nucleus and flip its spin. Currently, NMR spectroscopy and X-ray crystallography are the only techniques capable of determining the three-dimensional structures of macromolecules at atomic resolution. In contrast to X-ray crystallography, the NMR approach is complementary in different ways [1]:
- NMR directly probes the nuclei of protons (), , and .
- NMR can be applied to molecules for which no crystals are available. Thus, new structures can be obtained that are not available from X-ray studies.
- NMR spectroscopy is a powerful technique for investigating intramolecular dynamics on many timescales, for example, picoseconds to seconds. In addition, for a characterization of internal dynamics of biomacromolecular structures, NMR provides direct, quantitative measurements of the frequencies of certain high activation energy motional processes and at least semiquantitative information on additional high-frequency processes. In comparison, X-ray structure determinations may include an outline of the conformation space covered by high-frequency structural fluctuations.
The Physical Basis of NMR Spectroscopy
Preliminaries: Where Does the Magnetization Come From? nuclei (or spin nuclei) possess a spin that is associated with an angular momentum and a magnetic dipole moment. Each nucleus thus behaves like a little magnet that spins around its dipole axis. A single spin has the quantum mechanical property that, in an external magnetic field (measured in tesla, abbreviated T), only two orientations (called “parallel” and “antiparallel” or “ ” and “ ”; see figure 2.1) with respect to have a defined energy. The energy difference between these two states, , is given by
where is Planck’s constant, and is the gyromagnetic ratio ( radians per second per Tesla for ). Because of the angular momentum associated with spins, spins don’t align with the magnetic field , but precess around an axis parallel to with a frequency (the so-called Larmor frequency, ; see figure 2.2 and [4]).
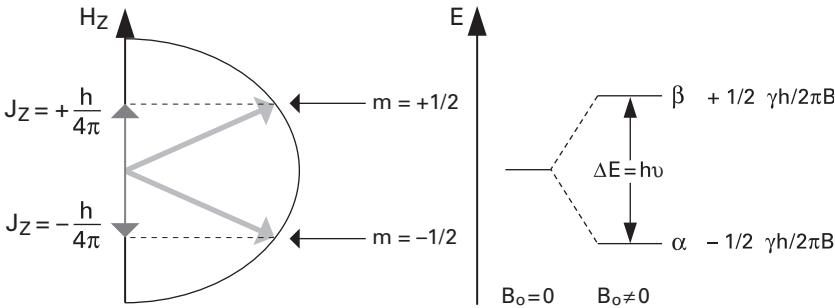
Figure 2.1 Energy levels of the – and – states of (and nuclei).
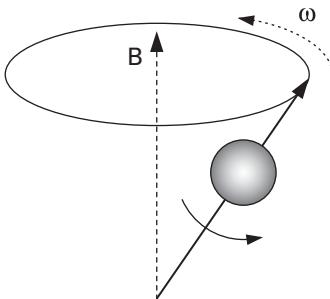
Figure 2.2 Rotation of nuclear momentum about its own axis and about the magnetic field axis.
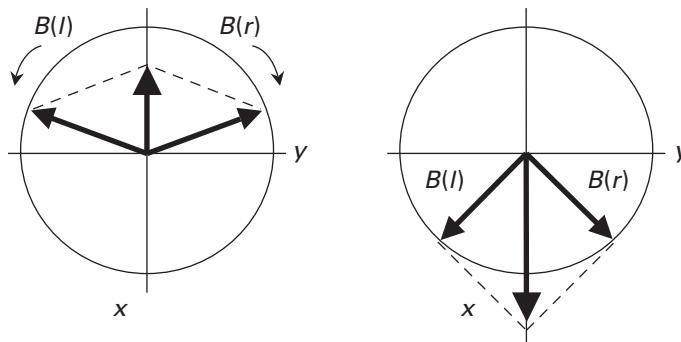
Figure 2.3 Representation of a linear alternating field (max ) as the sum of two rotating fields, (clockwise) and (anticlockwise).
In an NMR experiment, many spins are present. Since the energy difference between the states and is small compared to ( Boltzmann constant, absolute temperature), there is, at room temperature, only a small excess of spins in the energetically lower ground state, even in the highest available magnetic fields. In thermal equilibrium, the average magnetization from all molecules constitutes a macroscopic magnetization parallel to the magnetic field.
The NMR Experiment in a Nutshell In a high-resolution NMR experiment, a glass tube containing a water solution with the molecule of interest is placed in a static magnetic field and then subjected to irradiation by one (or several) radio-frequency (RF) fields. Typically, the solution is quite concentrated. Suppose an RF pulse is applied along the direction of the -axis. can be represented by two vectors with the same magnitude, , rotating in the -plane with the same frequency, . One of the vectors, , rotates clockwise, and the other, , rotates anticlockwise (figure 2.3).
Only the component precessing around with the same frequency and the same direction as the precessing nuclear dipoles can interact with (the macroscopic magnetization), denoted as . If instead of the fixed coordinate system , we use a rotating coordinate system , which rotates with the same frequency as , the effect of is to turn the vector about the -axis, that is, in the -plane. The angle through which is tipped increases with the amplitude and the duration of the pulse (figure 2.4a). A pulse is an RF pulse with the precise duration that takes to become transverse (i.e., perpendicular to ) on its way to the southern hemisphere (figure 2.4b).
If we place a detector (i.e., a coil) along the -axis, after a pulse, the system will induce a current in the detector, which is called free induction decay (FID) (figure 2.5). The FID decays exponentially with a decay constant . The decay constant (also called “relaxation time”) is generated by the magnetization vector gradually returning to equilibrium state when the RF pulse is switched off. Two different time constants describe this behavior:
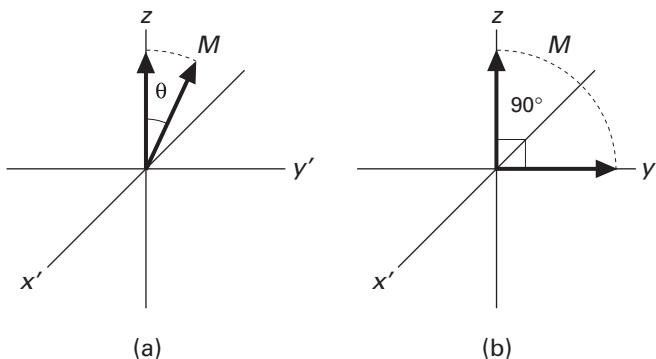
Figure 2.4 Direction of the macroscopic magnetization vector in the rotating coordinate system: (a) after a pulse of arbitrary angle ; (b) after a pulse.
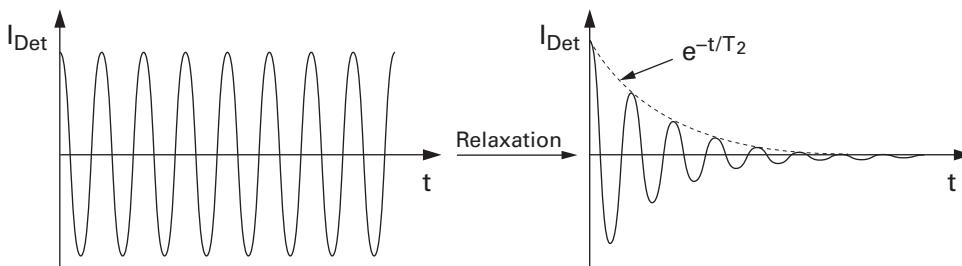
Figure 2.5 Left: signal in absence of transverse relation; right: real FID.
- The reestablishment of the equilibrium state distribution ();
- Dephasing of the transverse component (destruction of the coherent state, ).
The NMR spectrum is obtained from Fourier transformation of the FID by plotting the amplitude of the sine and cosine functions versus their frequencies (figure 2.6). The Fourier transformation is a mathematical procedure to represent any signal as a sum of sine and cosine functions with different frequencies.
Chemical Shifts
As mentioned in section 2.2, an atomic nucleus can have a magnetic moment (nuclear spin), which gives rise to different energy levels and resonance frequencies in a magnetic field. The total magnetic field experienced by a nucleus includes local magnetic fields induced by currents of electrons in the molecular orbitals. The electron distribution of the same type of nucleus (e.g., ,
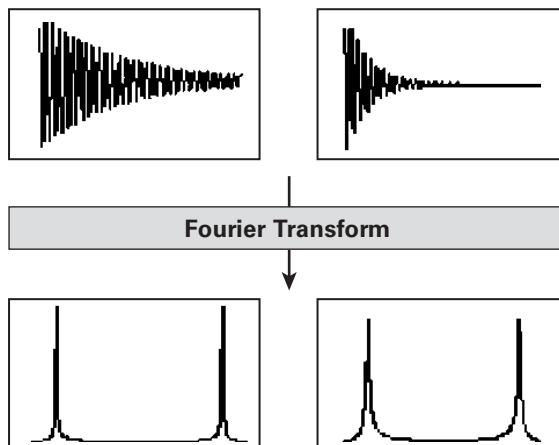
Figure 2.6 Slowly decaying FIDs lead to narrow lines (left), rapidly decaying ones to broad lines (right).
, ) usually varies according to the atom’s local electronic environment (including electrons from nearby atoms, i.e., covalent bonds, binding partners, bond lengths, angles between bonds, etc.). Therefore, the electronic environment of an atom shields or deshields it from the external magnetic field and the local magnetic field at each nucleus (different atoms with different local electronic environments “feel” a different external field and therefore resonate at different frequencies). This variation of NMR frequencies of the same kind of nucleus, due to variations in the electron distribution, is called the chemical shift. The size of the chemical shift is given with respect to a reference frequency or reference sample, usually a molecule with a minimally distorted electron distribution. Since an atom’s chemical shift is very sensitive to the local electronic environment (and thus structure), the chemical shifts can be considered as a sort of fingerprint for a molecule, and play an important role in NMR spectroscopy to identify the atoms and reveal the aspects of their local geometry. (See chapter 2 of [3] for details.)
Note Chemical shift is usually expressed in parts per million () by frequency, because it is calculated from
Introduction to NMR Experiments
NMR Spectrometer NMR spectrometers have a certain operating frequency, which depends on the strength of the applied magnetic field. Generally speaking, the higher the operating frequency, the better the resolution of the spectrum. For example, a 500-MHz spectrometer has a much stronger magnet than a 60-MHz spectrometer. In structural biology, 500, 600, 700, 800, and even 900 MHz instruments are commonly used.
Protein NMR Protein NMR is performed on aqueous samples of highly purified protein. The source of the protein can be either natural or produced in an expression system using recombinant DNA techniques through genetic engineering. Recombinantly expressed proteins are usually easier to produce in sufficient quantity, and make isotopic labeling possible.
The most abundant isotopes of carbon and oxygen, and , have no net nuclear spin, and thus NMR spectroscopy cannot be directly exploited to identify them. And the most abundant isotope of nitrogen, , although it has a net nuclear spin, also has a large quadrupolar moment, a property of the atomic nuclei that prevents high-resolution information to be obtained from this isotope. In fact, NMR of proteins from natural sources is sometimes restricted to utilizing NMR based solely on protons. Nevertheless, the less common isotopes, and , are ideal for NMR experiments, and therefore labeling the proteins with these nuclei opens up possibilities for doing more advanced experiments that detect or use these nuclei. Isotopic labeling is generally done by growing the expression host in a growth media enriched with the desired isotopes.
Note There are many different kinds of NMR experiments, and each type reveals some information about the structure or dynamics of the proteins. The different experiments also select for some specific kinds of atoms, for example, all protons or all protons that are part of a methyl group. However, it is not generally possible to select for a single residue.
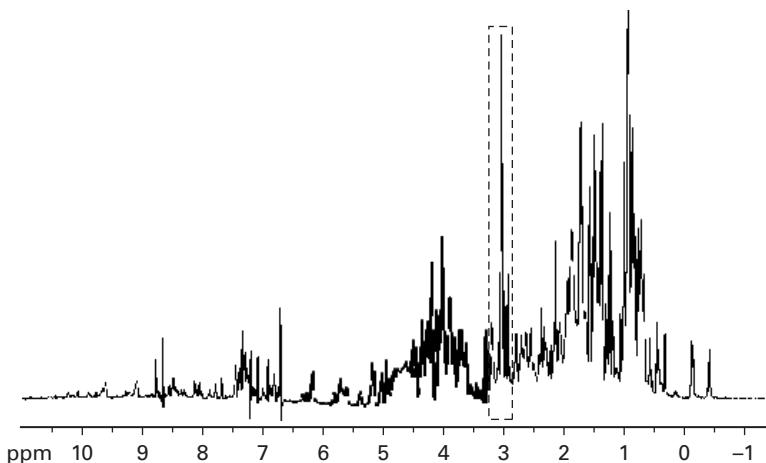
Figure 2.7 In a 1D spectrum assignment is very difficult because of the crowding/overlap.
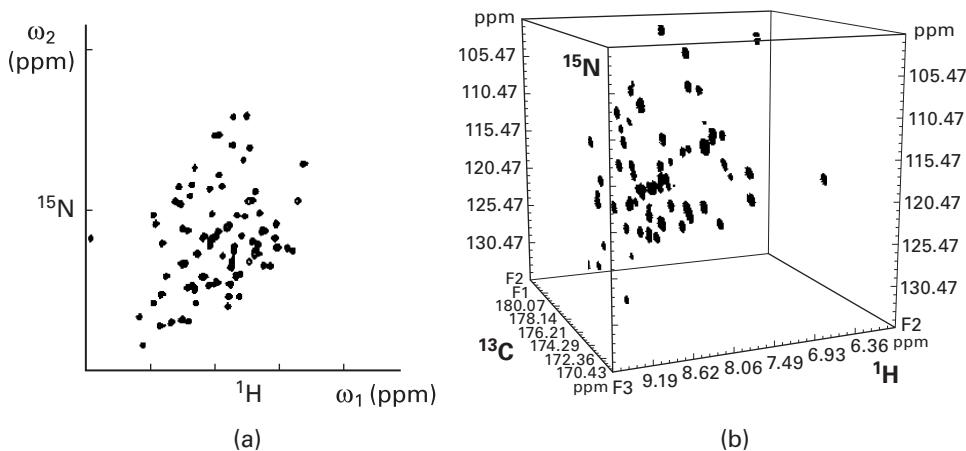
Figure 2.8 (a) Two-dimensional - correlation spectrum; (b) three-dimensional - - correlation spectrum.Multidimensional Spectra Although one-dimensional NMR spectral analysis, such as the -NMR spectrum, is useful for elucidating the structures of small organic molecules, for more complex samples arising from biopolymers, the resulting spectrum is far too complicated for interpretation as most of the signals overlap heavily (figure 2.7). Therefore, we often require two- and three-dimensional analysis for these samples using and nuclei.
Two-dimensional (2D) analysis basically measures the spectra of two different nuclei in a sample and plots them against each other. Figure 2.8a is an example of a 2D - correlation spectrum called heteronuclear single-quantum coherence (HSQC). These - correlation experiments exploit the relatively strong shielding effects (J coupling) between the amide hydrogens and their corresponding amide nitrogens in the protein samples. However, complex protein samples may still have some degree of peak overlap with 2D-NMR. Therefore higher dimensional experiments have been devised to deal with this problem. Currently, 3D and 4D spectra are routinely done, and 5D and 6D experiments are possible in advanced laboratories.
References
- [1] Kurt Wuthrich. NMR of Proteins and Nucleic Acids. New York: John Wiley & Sons, 1996.
- [2] P. J. Hore. Nuclear Magnetic Resonance. Oxford: Oxford University Press, 1995.
- [3] Horst Friebolin. Basic One-and Two-Dimensional NMR Spectroscopy. Weinheim: VCH Pub., 1990.
- [4] John Cavanagh, Wayne J. Fairbrother, Arthur G. Palmer III, Nicholas J. Skelton, and Mark Rance. Protein NMR Spectroscopy: Principles and Practice. New York: Academic Press, 2006.