Chapter 46Enzyme Redesign by SVM
This chapter discusses a support vector machine (SVM)-based method to predict the substrate specificity for wild type and mutants in a given protein sequence family [1]. SVMs have wide application in computational biology, and often good results may be obtained.
Overview
In Rausch et al. [1], a new support vector machine (SVM)-based approach was proposed to predict the substrate specificity of subtypes (adenylation domain, or A domain) of a given protein sequence family (nonribosomal peptide synthetases, or NRPS). Based on the physicochemical properties of the amino acids, the residues of NRPS were first encoded into vectors in a high dimensional feature space. A database of A domains with known specificities compiled from the literature was used to train the SVM classifier. The classifier was then used to predict the specificity of a new A domain. The machine learning approach can be generalized to the prediction of functional subspecificities of other classes of enzymes that “share a conserved structure but catalyze different substrates.”
Data Representation
A database of A domain sequences was collected from the protein databases and literature, and each sequence requires the occurrence of a complete NRPS module with at least one condensation domain, one A domain, and one peptidyl carrier domain. Specificity annotations of A domains are obtained from the published literature. In an A domain sequence with known specificity, the 34 residues within 8 distance from the substrate are extracted. Each residue is classified using 12 features, including the number of hydrogen bond donors, polarity, volume, secondary structure preferences, hydrophobicity, and isoelectric point. Thus, each A domain is represented by a vector with total features.
The Support Vector Machine (SVM) Approach
The SVM provides a powerful tool for data classification in a high-dimensional feature space. Burges provides a good introduction and survey on SVM [2].
The classical SVMs are “inductive,” where all training data are labeled. In many biological datasets, however, the amount of labeled data is small, and a large amount of unlabeled data is available. To address the problem of learning from both labeled and unlabeled data, the “transductive” SVM (TSVM) was developed. TSVMs assume that the missing labels of unlabeled data points are consistent with those of nearby points within the same cluster.
To evaluate the accuracy of a classifying algorithm, the following measurements are used:
- Error rate = ;
- Recall = sensitivity ;
- Precision = specificity ;
- Matthews correlation coefficient ,
where , , , and denote the number of true positive, false positive, true negative, and false negative predictions, respectively.
When using a single SVM model to predict the specificity, it is possible for all single SVMs to return a “negative” result—that is, no final prediction will be possible. In such a case, the single
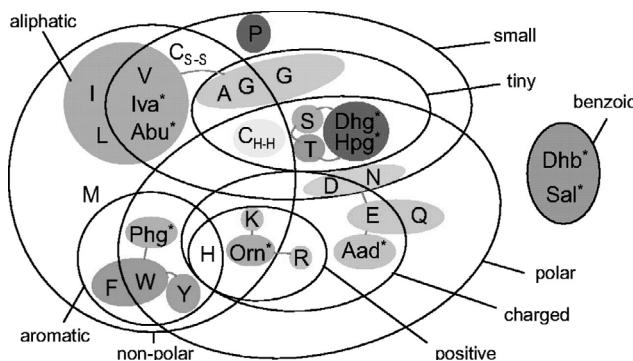
Figure 46.1 (plate 49) Addressing the side specificity problem by clustering specificities for amino acids with similar physicochemical properties. The colored sets show how similar amino acids have been clustered to composite specificities of A domains. To get larger clusters, several smaller clusters were joined, as indicated by red lines connecting colored sets. An asterisk indicates rare nonproteinogenic amino acids [1]. Reprinted with permission.
Table 46.1 Results of cross-validating the different SVMs by leave-one-out (LOO)
| Specificity of SVM | Positive training points | Kernel type | Leave-one-out
cross-validation |
MCC |
Quality of SVM | |
|---|---|---|---|---|---|---|
| Large clusters | ||||||
| Dhb=Sal | 22 | Labeled and 664 unlabeled data points (18 + 646) | 0.4 | 100 | 96 | +++ |
| Asp=Asn=Glu=Gln=Aad | 11 | r | 1.4 | 100 | 95 | +++ |
| Pro=Pip | 20 | r | 0.7 | 90 | 100 | +++ |
| Cys | 17 | r | 0.7 | 100 | 94 | +++ |
| Ser=Thr=Dhpg=Dpg=Hpg | 50 | r | 2.5 | 96 | 91 | +++ |
| Gly=Ala=Val=Leu=Ile=Abu=Iva | 92 | r | 4.3 | 95 | 93 | + |
| Om=Lys=Arg | 16 | r | 0.7 | 88 | 87 | + |
| Phe=Trp=Phg=Tyr=Bht | 33 | r | 3.2 | 88 | 85 | 0 |
| Small clusters | ||||||
| Dhb=Sal | 27 | Labeled and 673 unlabeled data points (27 + 646) | 0 | 100 | 100 | +++ |
| Aad | 11 | r | 0 | 100 | 100 | +++ |
| Glu=Gln | 7 | r | 0 | 100 | 100 | +++ |
| Dhpg=Dpg=Hpg | 20 | r | 0.4 | 100 | 95 | +++ |
| Ser | 13 | r | 0.4 | 92 | 100 | +++ |
| Cys | 17 | r | 0.7 | 100 | 94 | +++ |
| Thr | 16 | r | 0.7 | 94 | 93 | +++ |
| Pro | 16 | r | 0.7 | 94 | 93 | +++ |
| Asp=Asn | 21 | r | 1.1 | 90 | 95 | +++ |
| Val=Leu=Ile=Abu=Iva | 60 | r | 2.9 | 92 | 95 | + |
| Om | 8 | r | 0.7 | 88 | 87 | + |
| Gly=Ala | 32 | r | 3.3 | 81 | 90 | 0 |
| Tyr | 18 | r | 2.2 | 94 | 77 | 0 |
| Arg | 5 | r | 0.7 | 80 | 80 | 0 |
| Phe=Trp | 14 | r | 3.7 | 57 | 67 | 0 |
The more training data that are available the more reliable the trained predictive models are. The “quality of SVM” in the last column, therefore, is a qualitative measure for the MCC. Kernel type I stands for linear kernel and r stands for radial basis function kernel. Error rate, sensitivity (), specificity () and Mathews correlation coefficient (MCC) are given in percentage. [1]. Reprinted with permission.
SVM model may not be powerful enough to classify the data, and a multiclass SVM model [3] may be used to solve the problem.
The Side Specificity Problem In reality, A domains often have significant side specificities, which lead to alternate peptide products that differ at the corresponding point. This problem is addressed by clustering specificities for amino acids with similar physicochemical properties, as shown in figure 46.1 (plate 49). Two choices have been considered for clustering: grouping specificities into a few large clusters or into more small clusters. Grouping specificities into larger clusters has the advantages of (1) a larger positive dataset for SVM training, (2) a larger spectrum of sequence variations, (3) a larger subspace in the hyperspace, (4) a lower risk of overfitting, and (5) the recognition of similar substrate specificities. On the other hand, grouping specificities into small clusters has the advantage of more precise predictions, but entails a higher risk of overfitting to the training data.
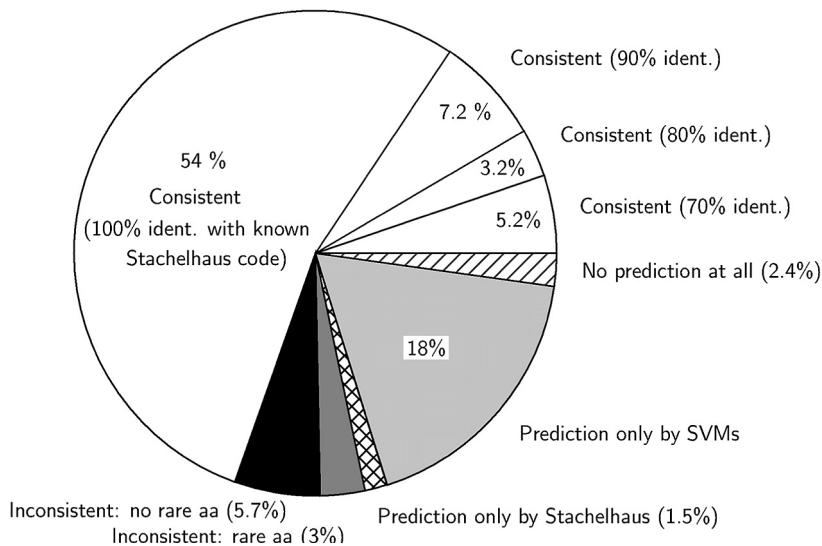
Figure 46.2 The comparisons of the SVM-based method with the sequence-based prediction method described in chapter 12.1 Of the 1,230 adenylation domains (with HMMER automatically extracted from the June 2005 version of UniProt) 70% or 858, obtained consistent predictions by both predictors (white sectors). For most of these consistent predictions (54% of the total, or 666), the Stachelhaus method was based on an exact match with a known “specificity-conferring code,” the others had at least a 70% match. To 2.4% or 29 sequences, none of the predictors can assign any specificity (no match > 70%, diagonal hatches). An 18% or 217 sequences, could be classified only by the SVMs and not by the Stachelhaus method (light gray sector), 18 A domains (1.5%) could not be classified by the SVMs but by the Stachelhaus method (cross-hatched), and 2 of them are rare specificities. The Stachelhaus predictions for the rest are based mainly on 70% matches to known specificity “codes.” For 108 sequences (8.8%) the predictions were inconsistent, but 38 of them (3% of the total, gray sector) had matches to rare amino acids that were not used for training the SVMs. The remaining 70 incompatible predictions were mainly based on < 80% identity matches with known “specificity-conferring codes” (black sector) [1]. Reprinted with permission.
Results
In implementing TSVM, different kernel functions, such as linear, polynomial, radial basis, and sigmoid functions, were tried. A grid search approach is used to determine the optimal kernel parameters. For each specificity cluster, the sequences belonging to a given specificity are labeled by “+”, all other sequences with different but known specificity are labeled by “–”, and the uncharacterized sequences are labeled by “0”. Table 46.1 shows a tabular overview of the results of the quality assessment of the models. Figure 46.2 shows the comparisons of the SVM-based method with the sequence-based prediction method described in chapter 12 section 12.1.
References
- [1] Christian Rausch, Tilmann Weber, Oliver Kohlbacher, Wolfgang Wohlleben, and Daniel H. Huson. Specificity prediction of adenylation domains in nonribosomal peptide synthetases (NRPS) using transductive support vector machines (TSVMs). Nucleic Acids Research 33;18 (2005):5799–5808.
- [2] C. J. C. Burges. A tutorial on support vector machines for pattern recognition. Data Mining and Knowledge Discovery 2 (1998): 121–167.
- [3] Bernhard Schlkopf, Koji Tsuda, and Jean-Philippe Vert (eds.). Kernel Methods in Computational Biology. Cambridge, MA: MIT Press, 2004.