Chapter 49Optimization of Surface Charge-Charge Interactions
This lecture presents the application of a genetic algorithm in optimizing solvent-exposed charge-charge interaction of Fyn SH3 domain. Based on experimental results, the designed variants have demonstrated an enhancement in thermostability compared to the wild-type protein [1].
Algorithm Input
The input to the genetic algorithm is a group of artificial (computational) “chromosomes” with length equal to the number of surface residues, which are subjected to optimization in the protein of interest. The chromosomes are feature vectors, and should not be confused with biological chromosomes made of DNA, histones, and chromatin. The term “chromosome” in genetic algorithms is chosen as a trope to biological inspiration. The chromosome is encoded with a sequence of “+”, “-”, and “o”, each of which represents the genetic type of its corresponding residues. For example, Lys and Arg are classified as genetic positive groups (+), Asp and Glu belong to genetic negative groups (-), and His, N-terminal, C-terminal are noncharged (o). Therefore, a chromosome in the input is a specific charge distribution among surface residues, which will be optimized. For example,
Genetic Algorithm
A genetic algorithm (GA) [2] runs iteratively on input chromosomes until certain exit conditions are met. Each cycle of genetic algorithm consists of three phases: chromosome scoring, parental chromosome selection and crossover, and child chromosome mutation, as shown in figure 49.1. In the phase of chromosome scoring, GA computes the energy score of each chromosome based on energy models. In the phase of parental chromosome selection and crossover, chromosomes with favorable scores are selected. Among these chromosomes, one part of them are passed directly to the next phase, and the rest are paired up and subjected to random crossover to generate two new child chromosomes. In the last phase, child chromosome mutation, some of the child chromosomes are randomly mutated at single positions. In the following subsections, more details will be presented for each phase of the algorithm. Genetic algorithms encode a heuristic search strategy, with no guarantees.
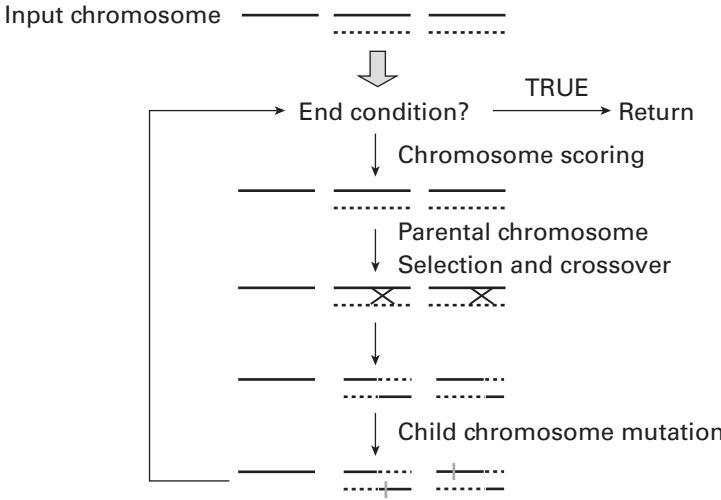
Figure 49.1 Overview of genetic algorithm.
49.2.1 Chromosome Scoring
Each chromosome is assigned an energy score , which is calculated as follows:
is the charge-charge interaction energy equal to the contribution of surface electrostatic interaction to Gibbs free energy of protein unfolding. This energy is approximated based on the following equation:
The equation sums over , the charge-charge interaction energy of group with the rest of the ionizable groups in the protein over all charged groups. The sum can also be viewed as the arithmetic sum of total electrostatic interactions over all interacting charged groups in each protonation state of the protein. , the charge-charge interaction of a unit charge placed at position and , is calculated from the TK-SA model [3], which simplifies a globular protein to approximate it as a sphere with annotated solvent-accessible areas.
If a chromosome is different from the chromosome encoded from wild type, a penalty in the unfolding energy will be paid. This penalty is calculated in the second term of equation (49.1), in which is the penalty energy per difference, and is the number of differences. By including the penalty in the score, a chromosome having a higher similarity to the wild type will be assigned a more favorable score, which indirectly maintains the wild-type structure and function of the protein’s variants.
Time Complexity For each chromosome, is computed in time, where is the length of the chromosome. is calculated in time, where is equal to . If there are chromosomes in the input, the total running time for chromosome scoring will be .
Parental Chromosome Selection and Crossover
In the second phase, chromosomes with a score that satisfies a certain threshold are selected as parental chromosomes, which form the parental population. Chromosomes with the best scores are passed directly to the next generation. The rest of the chromosomes in the parental population are paired up randomly and subjected to random crossover to generate child chromosomes. By the selection process, the overall score of the new generation is expected to be no worse than the input populations.
Time Complexity It takes time to construct parental population, where is the number of chromosomes in the input population. Chromosome pair-up and crossover takes time, since the maximum size of parental population is . Therefore, the total time complexity for chromosome selection and crossover phase is .
Child Chromosome Mutation
The newly generated chromosomes are subjected to random point mutations. A random number is assigned to determine which chromosome and which position on the chromosome will be mutated. The child chromosome population that passes this phase will enter the genetic algorithm as input for the next cycle of optimization.
Time Complexity The time complexity for this phase is .
There is no bound on how many phases (iterations) are required for a GA to converge or find an optimal solution. There is no guarantee of the quality or accuracy of the computed solution by a GA.
Computational and Experimental Validations
In the paper [1], Fyn5 is the output of the genetic algorithm with optimized surface charge-charge interaction. Five residues—Glu11, Asp16, His21, Asn30, and Glu46—are modified into Lys. Another three variants, named Fyn1, Fyn2, and Fyn3, are constructed with one, two, and three mutations for the study of cumulative effect of the mutations. Based on the prediction, the rank of protein stability is computed to be: . Finally, both computational and experimental approaches were applied to validate the predicted stability among these variants.
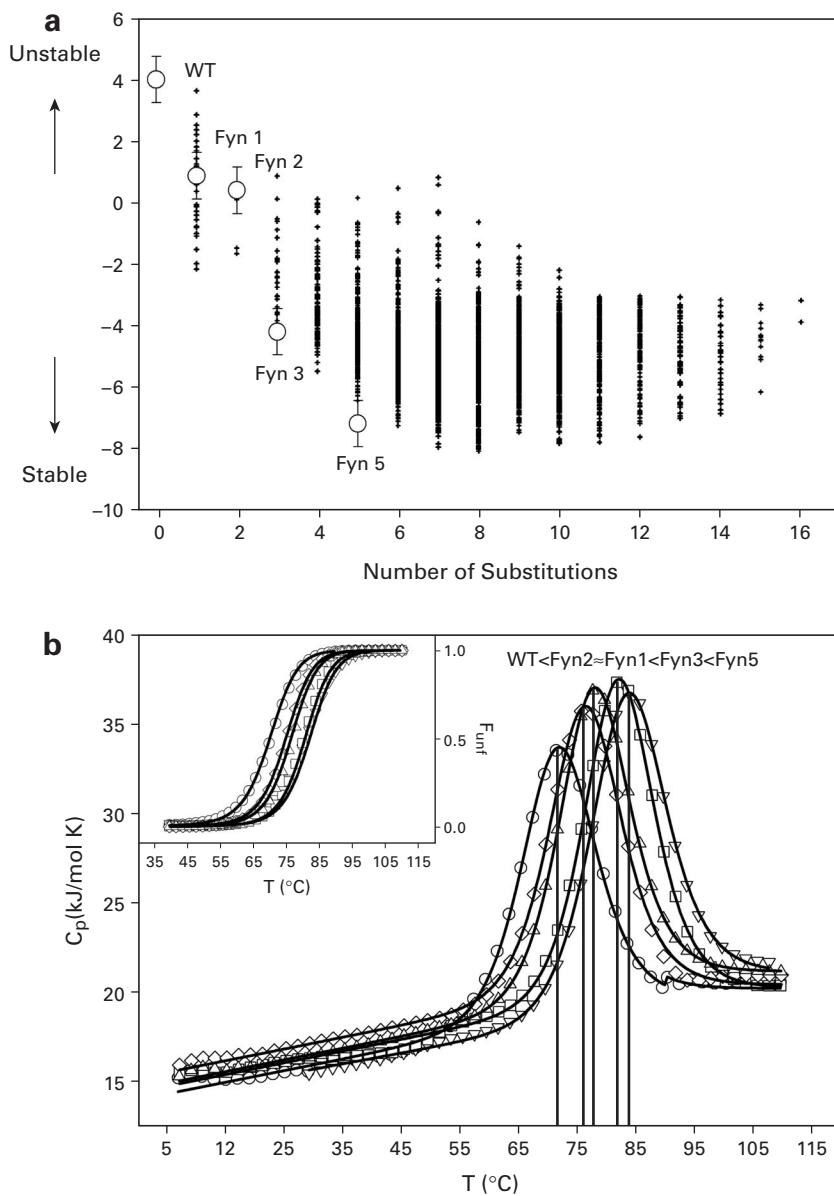
Figure 49.2 (a) Computed unfolding energy of variants and wild type. (b) DSC and CS spectrum of variants and wild type [1].
Computational Validations
The computed unfolding energies of the variants are shown in figure 49.2a. The stability increases from wild type to variant.
Experimental Validation
The four variants and the wild type were tested by differential scanning calorimetry (DSC), and circular dichroism spectroscopy (CD), which is shown in figure 49.2b. Both spectra generally demonstrated an increase in denaturing temperature from wild type to variants, that is, the stability was increased from wild type to . However, ambiguity was observed for the and variants.
References
- [1] Katrina L. Schweiker, Arash Zarrine-Afsar, Alan R. Davidson, and George I. Makhatadze. Computational design of the Fyn SH3 domain with increased stability through optimization of surface charge-charge interactions. Protein Science 16 (2007):2694–2702.
- [2] Beatriz Ibarra-Molero and Jose M. Sanchez-Ruiz. Genetic algorithm to design stabilizing surface-charge distributions in proteins. Journal of Physical Chemistry 106;26 (2002):6609–6613.
- [3] Beatriz Ibarra-Molero, Vakhtang V. Loladze, George I. Makhatadze, and Jose M. Sanchez-Ruiz. Thermal versus guanidine-induced unfolding of ubiquitin. An analysis in terms of the contributions from charge-charge interactions to protein stability. Biochemistry 38 (1999):8138–8149.