Chapter 20Reconstructing and Using Phylogenies

© Marian Hervett/Wayback Science Products
Key Concepts
- 20.1 All of Life Is Connected through Its Evolutionary History
- 20.2 Phylogeny Can Be Reconstructed from Traits of Organisms
- 20.3 Phylogeny Makes Biology Comparative and Predictive
- 20.4 Phylogeny Is the Basis of Biological Classification
Phylogenies allow us to understand the evolution of diversity, as within this single genus of South African plants (Protea).
Investigating Life: Using Phylogeny to Improve a Genetic Tool
Green fluorescent protein (GFP) was discovered in 1962 when Osamu Shimomura led a team that was able to purify the protein from the tissues of the bioluminescent jellyfish Aequorea victoria. Some 30 years after GFP’s initial discovery, Martin Chalfie had the idea (and the technology) to link the gene for GFP to other protein-coding genes so that the expression of specific genes of interest could be visualized in glowing green within cells and tissues of living organisms (see Figure 18.9). This work was extended by Roger Tsien, who changed some of the amino acids within GFP to create fluorescent proteins of several distinct colors. Different-colored fluorescent proteins meant that the expression of several different proteins could be visualized and studied in the same organism at the same time. These three scientists were awarded the 2008 Nobel Prize in Chemistry for the isolation and development of GFP for visualizing gene expression.
Tsien was able to produce different-colored proteins, but he could not produce a red protein. This was frustrating; a red fluorescent protein would be particularly useful to biologists because red light penetrates tissues more easily than do other colors. Tsien’s work stimulated Mikhail Matz to look for new fluorescent proteins in corals. Among the different coral species he studied, Matz found coral proteins that fluoresced in various shades of green, cyan (blue-green)—and red.
How had fluorescent red pigments evolved among the corals, given that the necessary molecular changes had eluded Tsien? To answer this question, Matz sequenced the genes of the fluorescent proteins and used these sequences to reconstruct the evolutionary history of the amino acid changes that produced different colors in different species of corals.
Matz’s work showed that the ancestral fluorescent protein in corals was green, and that red fluorescent proteins evolved in a series of gradual steps. His analysis of evolutionary relationships allowed him to retrace these steps. Such an evolutionary history, as depicted in a tree of relationships among lineages, is called a phylogeny.
The evolution of many aspects of an organism’s biology can be studied using phylogenetic methods. This information is used in all fields of biology to understand the structure, function, and behavior of organisms.
QA How are phylogenetic methods used to resurrect protein sequences from extinct organisms? (Find the answer on page 462.)
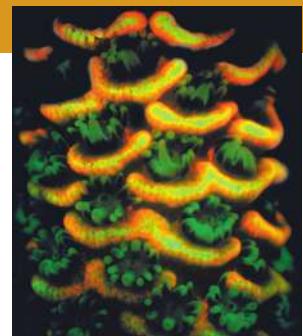
© Marian Hervett/Wayback Science Products
All of Life Is Connected through Its Evolutionary History
Learning Objectives
- 20.1.1 Draw and label the parts of a phylogenetic tree and explain the biological interpretation of each part.
- 20.1.2 Use a phylogenetic tree to determine relationships and infer character changes among species.
- 20.1.3 Explain how homoplasies (convergences and reversals of characters) are accounted for when constructing phylogenetic relationships.
The sequencing of complete genomes from many diverse species has confirmed what biologists have long suspected: all of life is related through a common ancestor. The common ancestry of life explains why the general principles of biology apply to all organisms. Thus we can learn much about how the human genome works by studying the biology of model organisms because we share a common evolutionary history with those organisms. The evolutionary history of these relationships is known as phylogeny, and a phylogenetic tree is a diagrammatic reconstruction of that history.
Phylogenetic trees depict evolutionary relationships among lineages
Phylogenetic trees are commonly used to depict the evolutionary history of species, populations, and genes. For many years such trees have been constructed based on physical structures, behaviors, and biochemical attributes of related organisms. Now, as genomes are sequenced for more and more organisms, biologists are able to reconstruct the history of life in ever greater detail.
In Chapter 19 we discussed why we expect populations of organisms to evolve over time. We call a series of ancestor and descendant populations a lineage, which we can depict as a line drawn on a time axis, as shown in Figure 20.1. What happens when a single lineage divides into two? For example, a geographic barrier may divide an ancestral population into two descendant populations that no longer interbreed with one another. We depict such an event as a split, or node, in a phylogenetic tree (see Figure 20.1). Each of the descendant populations gives rise to a new lineage, and as these independent lineages evolve, new traits arise in each. As the lineages continue to split over time, this history can be represented in the form of a branching tree that can be used to trace the evolutionary relationships from the ancient common ancestor of a group of species, through the various lineage splits, up to the present populations of the organisms.
A phylogenetic tree may portray the evolutionary history of all life forms. Phylogenetic trees can also depict the history of a major evolutionary group (such as the insects) or of a much smaller group of closely related species. In some cases, phylogenetic trees are used to show the history of individuals, populations, or genes within a species. The common ancestor of all the organisms in the tree forms the root of the tree.
The depictions of phylogenetic trees in this book are rooted at the left, with time flowing from left (earliest) to right (most recent) (Figure 20.2A). The timing of splitting events in lineages is shown by the position of nodes on a time axis. These splits represent events where one lineage diverged into two, such as a speciation event (for a tree of species), a gene duplication event (for a tree of genes), or a transmission event (for a tree of viral lineages transmitted through a host population). The time axis may have an explicit scale, or it may simply show the relative timing of divergence events.
In this book’s illustrations, the order in which nodes are placed along the horizontal (time) axis has meaning, but the vertical distance between the branches does not. Vertical distances have been adjusted for legibility and clarity of presentation; they do not correlate with the degree of similarity or difference among groups. Note too that lineages can be rotated around nodes in the tree, so the vertical order of lineages is also largely arbitrary (Figure 20.2B). The important information in the tree is the branching order along the time axis, as this indicates when the various lineages last shared a common ancestor.
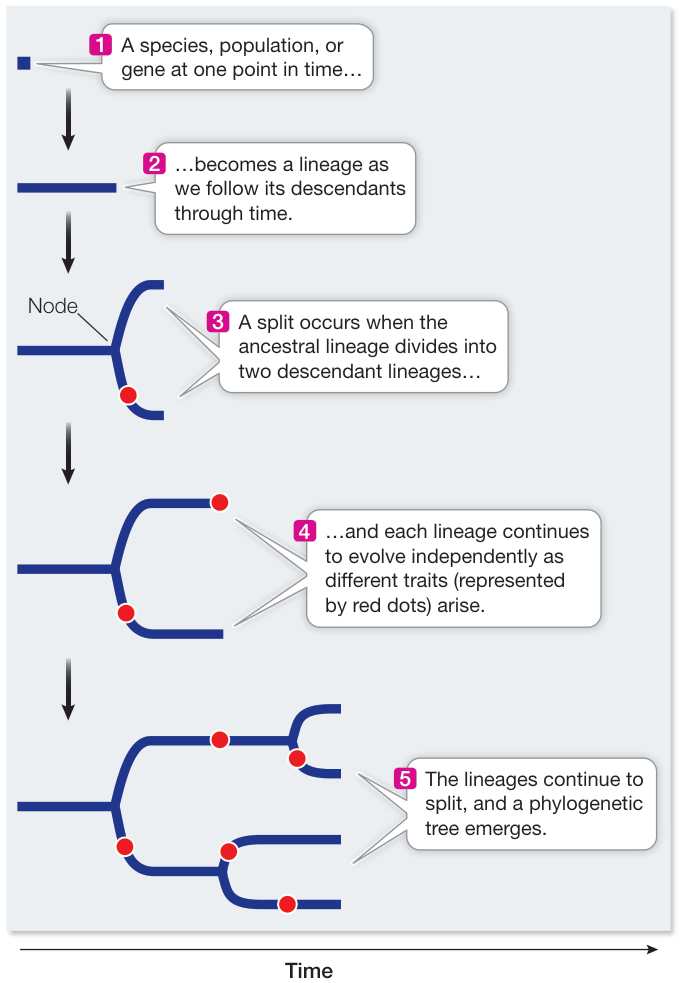
Figure 20.1 The Components of a Phylogenetic Tree Evolutionary relationships among organisms can be represented in a treelike diagram.
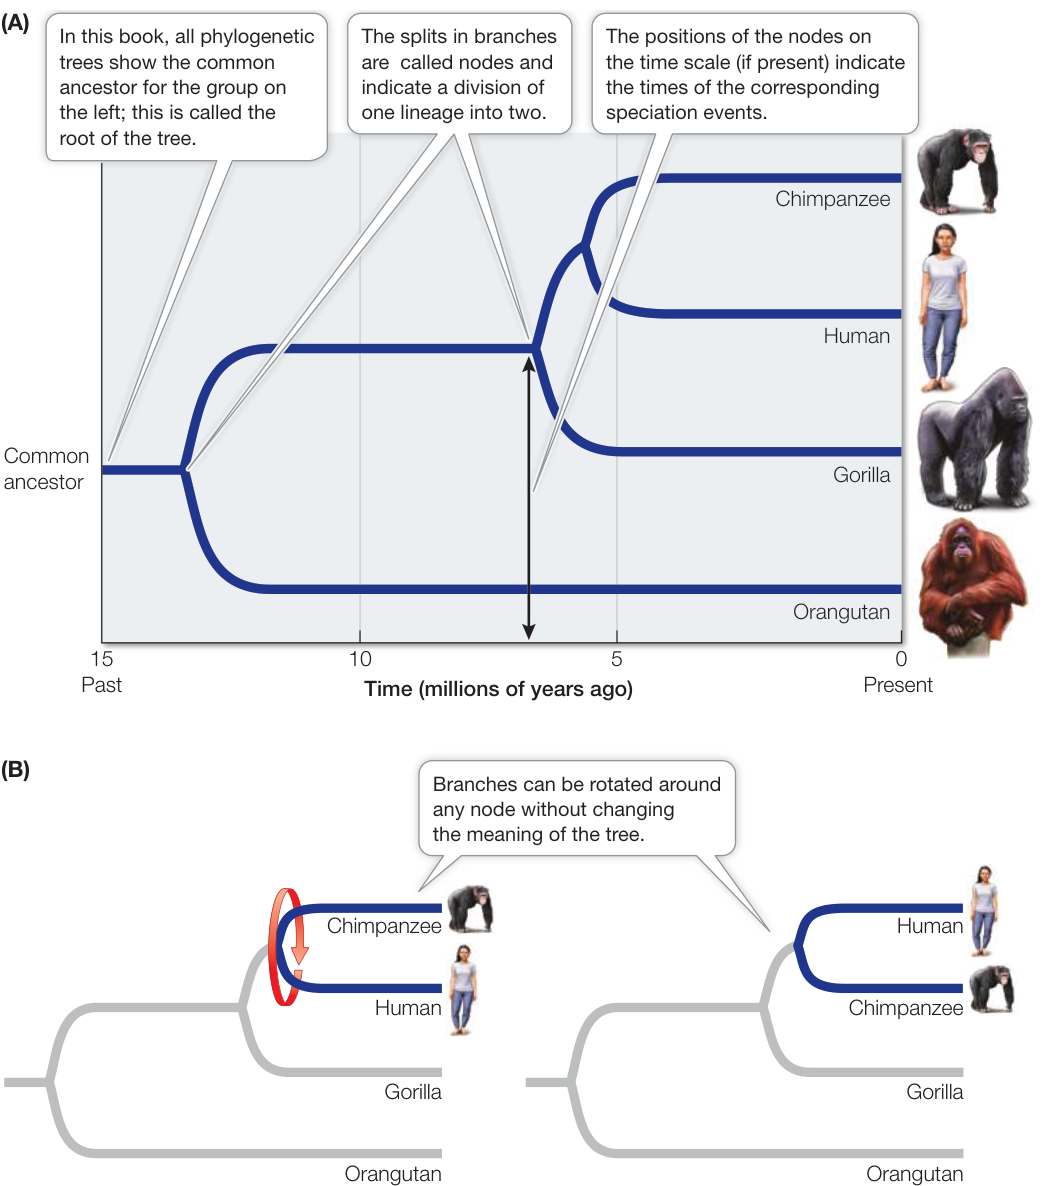
Figure 20.2 How to Read a Phylogenetic Tree (A) Phylogenetic trees can be produced with time scales, as shown here, or with no indication of time. If no time scale is shown, then the trees are meant to depict only the relative order of divergence events. (B) Lineages can be rotated around a given node, so the vertical order of taxa is largely arbitrary.
Any group of species that we designate with a name is a taxon (plural taxa). Examples of familiar taxa include humans, primates, mammals, and vertebrates; in this series, each taxon is also a member of the next, more inclusive taxon. Any taxon that consists of all the evolutionary descendants of a common ancestor is called a clade. Clades can be identified by picking any point on a phylogenetic tree and from that point tracing all the descendant lineages to the tips of the terminal branches (Figure 20.3). Two species that are each other’s closest relatives are called sister species. Similarly, any two clades that are each other’s closest relatives are sister clades.
Before the 1980s, phylogenetic trees tended to be seen only in the literature on evolutionary biology, especially in the area of systematics—the study and classification of biodiversity. But almost every journal in the life sciences published over the past few decades contains phylogenetic trees. Trees are widely used in molecular biology, biomedicine, physiology, behavior, ecology, and virtually all other fields of biology. Why have phylogenetic studies become so widespread?
Phylogenetic trees are the basis of comparative biology
In biology we study life at all levels of organization—from genes, cells, organisms, populations, and species to the major divisions of life. In most cases, however, no individual gene or organism (or other unit of study) is exactly like any other gene or organism that we investigate.
Consider the individuals in your biology class. We recognize each person as an individual human, but we know that no two are exactly alike. If we knew everyone’s family tree in detail, the genetic similarity of any pair of students would be more predictable. We would find that more closely related students have many more traits in common (from the color of their hair to their susceptibility or resistance to diseases). Likewise, biologists use phylogenies to make comparisons and predictions about shared traits across genes, populations, and species.
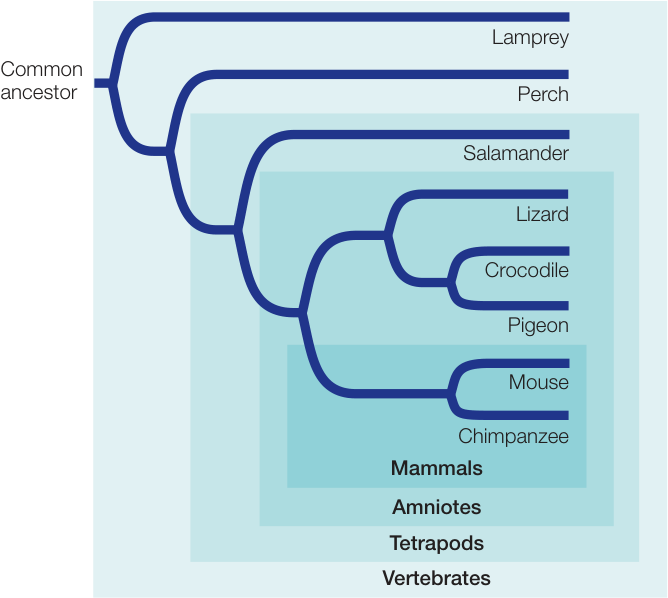
Figure 20.3 Clades Represent an Ancestor and All of Its Evolutionary Descendants All clades are subsets of larger clades, with all of life as the most inclusive taxon. In this example, the groups called mammals, amniotes, tetrapods, and vertebrates represent successively larger clades. Only a few species within each clade are represented on the tree.
The evolutionary relationships among species, as represented in the tree of life, form the basis for biological classification. Biologists estimate that there are tens of millions of species on Earth. So far, however, only about 1.8 million species have been classified—that is, formally described and named. New species are being discovered all the time and phylogenetic analyses are constantly reviewed and revised, so our knowledge of the tree of life is far from complete. Yet knowledge of evolutionary relationships is essential for making comparisons in biology, so biologists build phylogenies for groups of interest as more data become available. The tree of life’s evolutionary framework allows us to make many predictions about the behavior, ecology, physiology, genetics, and morphology of species that have not yet been studied in detail.
When biologists compare species, they observe traits that differ within the group of interest and try to understand when these traits evolved. In many cases, investigators are interested in how the evolution of a trait relates to environmental conditions or selective pressures. For instance, scientists have used phylogenetic analyses to discover changes in the genome of human immunodeficiency viruses (HIVs) that result in resistance to particular drug treatments. The association of a particular genetic change in HIV with a particular treatment provides a hypothesis about the evolution of resistance that can be tested experimentally.
Any features shared by two or more species that have been inherited from a common ancestor are said to be homologous.
Homologous features may be any heritable traits, including DNA sequences, protein structures, anatomical structures, and even some behavior patterns. For example, all living vertebrates have a vertebral column, as did the ancestral vertebrate. Therefore the vertebral column is judged to be homologous in all vertebrates.
Derived traits provide evidence of evolutionary relationships
In tracing the evolution of a character, biologists distinguish between ancestral and derived traits. Each character of an organism evolves from one condition (the ancestral trait) to another condition (the derived trait). Derived traits that are shared among a group of organisms and are also viewed as evidence of the common ancestry of the group are called synapomorphies (syn, “shared,” + apo, “derived,” + morph, “form,” referring to the “form” of a trait). Thus the vertebral column is considered a synapomorphy—a shared, derived trait—of the vertebrates. (The ancestral trait was an undivided supporting rod as still occurs in some close relatives of vertebrates.)
Not all similar traits are evidence of relatedness. Similar traits in unrelated groups of organisms can develop for either of the following reasons:
- Superficially similar traits may evolve independently in different lineages, a phenomenon called convergent evolution. For example, although the forelimb bones of bats and birds are homologous, having been inherited from a common tetrapod ancestor, the wings of bats and birds are not homologous because they evolved independently from the forelimbs of different nonflying ancestors (Figure 20.4). Functionally similar structures that have independent evolutionary origins are called analogous characters.
- A character may revert from a derived state back to an ancestral state in an event called an evolutionary reversal. For example, the derived limbs of terrestrial tetrapods evolved from the ancestral fins of their aquatic ancestors. Then, within the mammals, the ancestors of modern cetaceans (whales and dolphins) returned to the ocean, and cetacean limbs evolved to once again resemble their ancestral state—fins. The superficial similarity of cetacean and fish fins does not suggest a close relationship between these groups. Instead, the similarity arises from evolutionary reversal.
Similar traits generated by convergent evolution and evolutionary reversals are called homoplastic traits or homoplasies.
A particular trait may be ancestral or derived, depending on our point of reference. For example, all birds have feathers. We infer from this that feathers (which are highly modified scales) were present in the common ancestor of modern birds. Therefore we consider the presence of feathers to be an ancestral trait for any particular group of modern birds, such as the songbirds. However, feathers are not present in any other living animals. In reconstructing a phylogeny of all living vertebrates, the presence of feathers is a derived trait found only among birds, and thus is a synapomorphy of the birds.
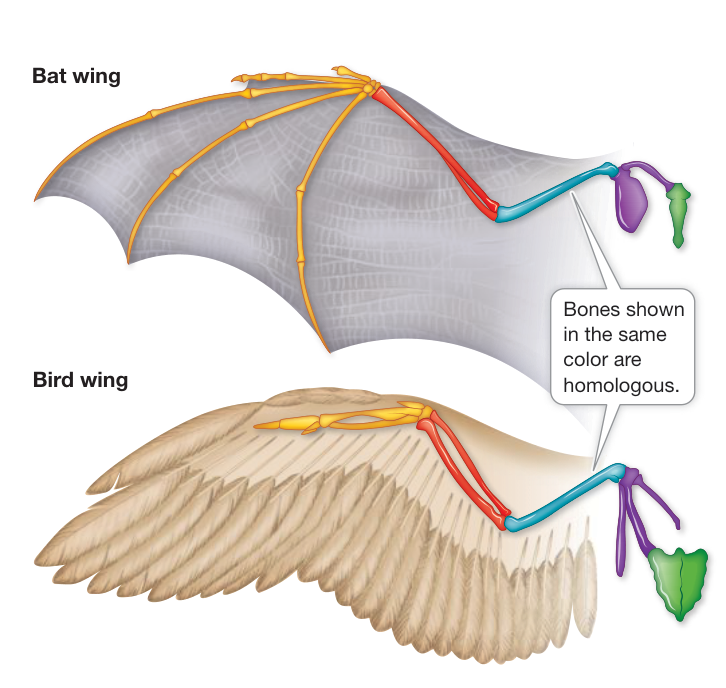
Figure 20.4 The Bones Are Homologous, the Wings Are Not The supporting bone structures of both bat wings and bird wings are derived from a common four-limbed ancestor and are thus homologous. However, the wings themselves—an adaptation for flight—evolved independently in the two groups.
Recap and Assess
A phylogenetic tree is a description of evolutionary relationships among organisms or their genes. All living organisms share a common ancestor and are related through the phylogenetic tree of life. Groups of related species that are descended from the same common ancestor are known as clades. Shared derived traits (known as synapomorphies) provide evidence for evolutionary relationships among species.
- What biological processes are represented in phylogenetic trees?
- Why is it important to consider only homologous characters in constructing phylogenetic trees?
- Why might similar traits arise independently in species that are only distantly related? Can you think of examples among familiar organisms? How do biologists account for these homoplasies in reconstructing phylogenies?
Phylogenetic analyses have become increasingly important to many types of biological research in recent years, and they are the basis for the comparative nature of biology. For the most part, however, evolutionary history cannot be observed directly. How, then, do biologists reconstruct the past? One way is by using phylogenetic analyses to construct a tree.
Phylogeny Can Be Reconstructed from Traits of Organisms
Learning Objectives
- 20.2.1 Analyze a phylogenetic tree to identify synapomorphies, homoplasies, and relationships among taxa.
- 20.2.2 Construct a phylogenetic tree from a data matrix of characters.
To illustrate how a phylogenetic tree is constructed, consider the eight vertebrate animals listed in Table 20.1: lamprey, perch, salamander, lizard, crocodile, pigeon, mouse, and chimpanzee. We will initially assume that any given derived trait arose only once during the evolution of these animals (that is, there has been no convergent evolution), and that no derived traits were lost from any of the descendant groups (there has been no evolutionary reversal). For simplicity, we have selected traits that are either present (+) or absent (-).
Shared traits reflect common ancestry
In a phylogenetic study, the group of organisms of primary interest is called the ingroup. As a point of reference, an ingroup is compared with an outgroup: a species or group that is closely related to the ingroup but is known to be phylogenetically outside it. In other words, the root of the tree is located between the ingroup and the outgroup. Any trait that is present in both the ingroup and the outgroup must have evolved before the origin of the ingroup and thus must be ancestral for the ingroup. In contrast, traits that are present in only some members of the ingroup must be derived traits within that ingroup. As we will see in Chapter 31, a group of jawless fishes called the lampreys is thought to have separated from the lineage leading to the other vertebrates before the jaw
Table 20.1 Eight Vertebrates and the Presence or Absence of Some Shared Derived Traits
| Taxon | Jaws | Lungs | Claws or nails | Gizzard | Feathers | Fur | Mammary glands | Keratinous scales |
|---|---|---|---|---|---|---|---|---|
| Lamprey (outgroup) | - | - | - | - | - | - | - | - |
| Perch | + | - | - | - | - | - | - | - |
| Salamander | + | + | - | - | - | - | - | - |
| Lizard | + | + | + | - | - | - | - | + |
| Crocodile | + | + | + | + | - | - | - | + |
| Pigeon | + | + | + | + | + | - | - | + |
| Mouse | + | + | + | - | - | + | + | - |
| Chimpanzee | + | + | + | - | - | + | + | - |
arose. Therefore we have included the lamprey as the outgroup for our analysis. Because derived traits are traits acquired by other members of the vertebrate lineage after they diverged from the outgroup, any trait that is present in both the lamprey and the other vertebrates is judged to be ancestral.
We begin by noting that the chimpanzee and mouse share two traits—mammary glands and fur—that are absent in both the outgroup and in the other species of the ingroup. Therefore we infer that mammary glands and fur are derived traits that evolved in a common ancestor of chimpanzees and mice after that lineage separated from the lineages leading to the other vertebrates. These characters are synapomorphies that unite chimpanzees and mice (as well as all other mammals, although we have not included other mammalian species in this example). By the same reasoning, we can infer that the other shared derived traits are synapomorphies for the various groups in which they are expressed. For instance, keratinous scales are a synapomorphy of the lizard, crocodile, and pigeon.
Table 20.1 also tells us that, among the animals in our ingroup, the pigeon has a unique trait: feathers. Feathers are a synapomorphy of birds and their extinct relatives. However, because we have only one bird in this example, the presence of feathers provides no clues concerning relationships among these eight species of vertebrates. However, gizzards are found in both birds and crocodiles, so this trait is evidence of a close relationship between birds and crocodilians.
By combining information about the various synapomorphies, we can construct a phylogenetic tree. We infer from our information that mice and chimpanzees—the only two animals that share fur and mammary glands—share a more recent common ancestor with each other than they do with pigeons and crocodiles. Otherwise we would need to assume that the ancestors of pigeons and crocodiles also had fur and mammary glands but subsequently lost them. There is no basis for making these additional assumptions.
Figure 20.5 shows a phylogenetic tree for the vertebrates in Table 20.1, based on the shared derived traits we examined. This particular tree was easy to construct because it is based on a very small sample of traits, and the derived traits we examined evolved only once and were never lost after they appeared. Had we included a snake in the group, our analysis would not have been as straightforward. We would have needed to examine additional characters to determine that snakes evolved from a group of lizards that had limbs. In fact, the analysis of many characters shows that snakes evolved from burrowing lizards that became adapted to a subterranean existence.
Parsimony provides the simplest explanation for phylogenetic data
The phylogenetic tree shown in Figure 20.5 is based on only a very small sample of traits. Typically, biologists construct phylogenetic trees using hundreds or thousands of traits. With larger data sets, we would expect to observe traits that have changed more than once, and thus would expect to see convergence and evolutionary reversal. How do we determine which traits are synapomorphies and which are homoplasies? One way is to invoke the principle of parsimony.
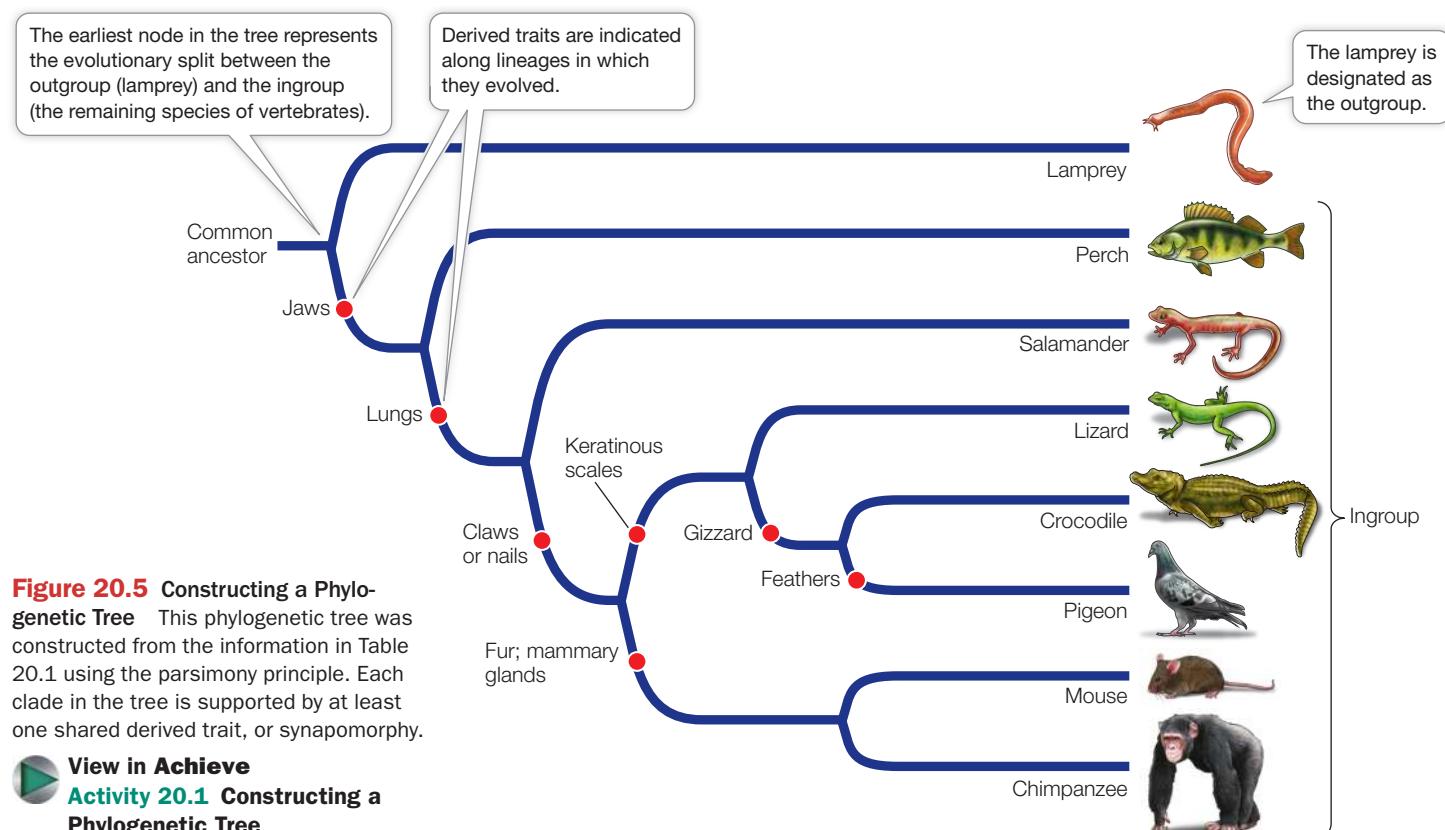
Figure 20.5 Constructing a Phylogenetic Tree This phylogenetic tree was constructed from the information in Table 20.1 using the parsimony principle. Each clade in the tree is supported by at least one shared derived trait, or synapomorphy. Activity 20.1 Constructing a Phylogenetic Tree
In its most general form, the parsimony principle states that the preferred explanation of observed data is the simplest explanation. Applying the principle of parsimony to the reconstruction of phylogenies entails minimizing the number of evolutionary changes that need to be assumed over all characters in all groups in the tree. In other words, the best hypothesis under the parsimony principle is one that requires the fewest homoplasies. This application of parsimony is a specific case of a general principle of reasoning called Occam’s razor: the best explanation is the one that best fits the data while making the fewest assumptions. More complicated explanations are accepted only when the evidence requires them. Phylogenetic trees represent our best estimates about evolutionary relationships, given our current knowledge. They are continually modified as additional evidence becomes available.
Phylogenies are reconstructed from many sources of data
Naturalists have constructed various forms of phylogenetic trees for more than 150 years. In fact, the only figure in the first edition of On the Origin of Species was a phylogenetic tree. Tree construction has been revolutionized, however, by the advent of computer software that allows us to consider far more data and analyze far more traits than could ever before be processed. Combining these advances in methodology with the massive comparative data sets being generated through studies of genomes, biologists are learning details about the tree of life at a remarkable pace (see Appendix A: The Tree of Life).
Any trait that is genetically determined, and therefore heritable, can be used in a phylogenetic analysis. Evolutionary relationships can be revealed through studies of morphology, development, the fossil record, behavioral traits, and molecular traits such as DNA and protein sequences. Let’s take a closer look at the types of data used in modern phylogenetic analyses.
MORPHOLOGY An important source of phylogenetic information is morphology: the presence, size, shape, and other attributes of body parts. Since living organisms have been observed, depicted, collected, and studied for millennia, we have a wealth of recorded morphological data as well as extensive museum and herbarium collections of organisms whose traits can be measured. New technological tools, such as the electron microscope and computed tomography (CT) scans, enable systematists to examine and analyze the structures of organisms at much finer scales than was formerly possible.
Most species are described and known primarily by their morphology, and morphology still provides the most comprehensive data set available for many taxa. The morphological features that are important for phylogenetic analysis are often specific to a particular group. For example, the presence, development, shape, and size of various features of the skeletal system are important in vertebrate phylogeny, whereas floral structures are important for studying the relationships among flowering plants.
Morphological approaches to phylogenetic analysis have some limitations, however. Some taxa exhibit little morphological diversity, despite great species diversity. For example, the phylogeny of the leopard frogs of North and Central America would be difficult to infer from morphological differences alone, because the many species look very similar, despite important differences in their behavior and physiology. At the other extreme, few morphological traits can be compared across distantly related species (earthworms and mammals, for example). Furthermore, some morphological variation has an environmental (rather than a genetic) basis and so must be excluded from phylogenetic analyses. An accurate phylogenetic analysis often requires information beyond that supplied by morphology.
DEVELOPMENT Similarities in developmental patterns may reveal evolutionary relationships. Some organisms exhibit similarities only in early developmental stages. The larvae of marine creatures called sea squirts, for example, have a flexible gelatinous rod in the back—the notochord—that disappears as the larvae develop into adults. All vertebrate animals also have a notochord at some time during their development (Figure 20.6). This shared structure is one of the reasons for inferring that sea squirts are more closely related to vertebrates than would be suspected if only adult sea squirts were examined.
Connect the Concepts Evolutionary developmental biology, discussed in Chapter 21, compares the developmental processes of different organisms to determine the ancestral relationship between them, and to discover how developmental processes evolved. Genetic toolkit genes are expressed in different ways in different species, resulting in major morphological differences among species. The existence of highly conserved genes involved in development makes it likely that similar traits will evolve repeatedly.
PALEONTOLOGY The fossil record is another important source of information on evolutionary history. Fossils show us where and when organisms lived in the past and give us an idea of what they looked like. Fossils provide important evidence that helps us distinguish ancestral from derived traits. The fossil record can also reveal when lineages diverged and began their independent evolutionary histories. Furthermore, in groups with few species that have survived to the present, information on extinct species is often critical to an understanding of the large divergences among the surviving species. The fossil record has limitations, however. Few or no fossils have been found for some groups, and the fossil record for many groups is fragmentary.
BEHAVIOR Some behavioral traits are culturally transmitted and others are genetically inherited. If a particular behavior is culturally transmitted, it may not accurately reflect evolutionary relationships (but may nonetheless reflect cultural connections). Many bird songs, for instance, are learned and may be inappropriate traits for phylogenetic analysis. Frog calls, however, are genetically determined and appear to be acceptable sources of information for reconstructing phylogenies.
MOLECULAR DATA All heritable variation is encoded in DNA, and so the complete genome of an organism contains an enormous set of traits (the individual nucleotide bases of DNA) that can be used in phylogenetic analyses. In recent years, DNA sequences have become among the most widely used sources of data for constructing phylogenetic trees. Comparisons of nucleotide sequences are not limited to the DNA in the cell nucleus. Eukaryotes have genes in their mitochondria as well as in their nuclei. Plant cells also have genes in their chloroplasts. The chloroplast genome (cpDNA), which is used extensively in phylogenetic studies of plants, has changed slowly over evolutionary time, so it is often used to study relatively ancient phylogenetic relationships. Most animal mitochondrial DNA (mtDNA) has changed more rapidly, so mitochondrial genes are used to study evolutionary relationships among closely related animal species (the mitochondrial genes of plants evolve more slowly). Many nuclear gene sequences are also commonly analyzed, and now that entire genomes have been sequenced from many species, they too are used to construct phylogenetic trees. Information on gene products (such as the amino acid sequences of proteins) is also widely used for phylogenetic analyses.
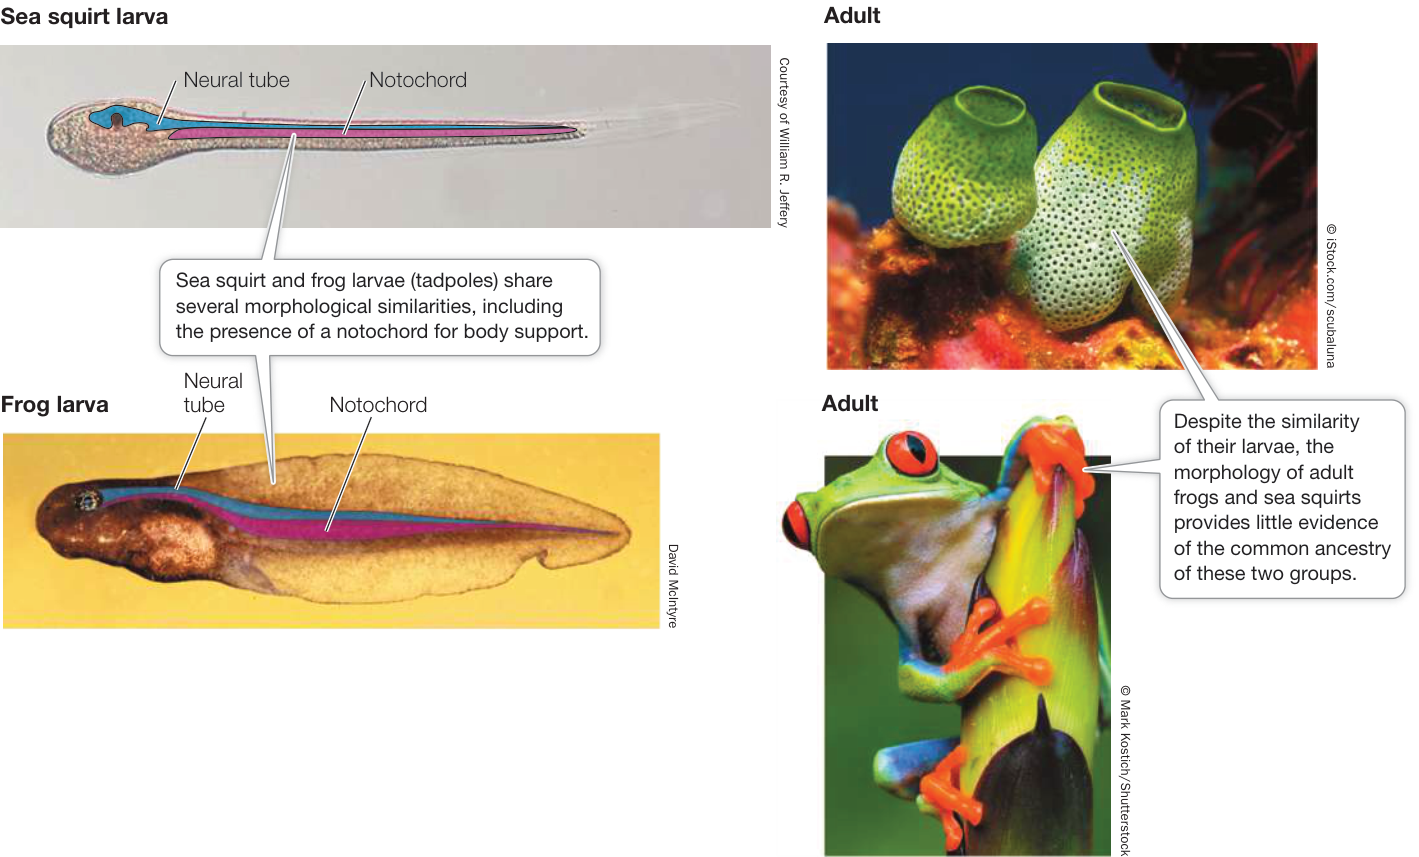
Figure 20.6 Development Reveals the Evolutionary Relationship between Sea Squirts and Vertebrates All chordates—a taxonomic group that includes sea squirts and frogs—have a notochord at some stage of their development. The larvae share similarities that are not apparent in the adults. Such similarities in development can provide useful evidence of evolutionary relationships. The notochord is lost in adult sea squirts. In adult frogs, as in all vertebrates, the vertebral column replaces the notochord as the support structure.
Mathematical models expand the power of phylogenetic reconstruction
As biologists began to use DNA sequences to infer phylogenies in the 1970s and 1980s, they developed explicit mathematical models describing how DNA sequences change over time. These models account for multiple changes at a given position in a DNA sequence. They also take into account different rates of change at different positions in a gene, at different positions in a codon, and among different nucleotides. For example, nucleotide transitions (changes between two purines or between two pyrimidines) usually occur more often than transversions (changes between a purine and pyrimidine).
Mathematical models can be used to compute how a tree might evolve given the observed data. A maximum likelihood method will identify the tree that most likely produced the observed data, given the assumed model of evolutionary change. Maximum likelihood methods can be used for any kind of data, but they are most often used with molecular data, for which explicit mathematical models of evolutionary change are easier to develop. The principal advantages of maximum likelihood analyses are that they incorporate more information about evolutionary change than do parsimony methods, and they are easier to treat in a statistical framework. The principal disadvantages are that they are computationally intensive and require explicit models of evolutionary change (which may not be available for some kinds of character changes).
The accuracy of phylogenetic methods can be tested
If phylogenetic trees represent reconstructions of past events, and if many of these events occurred before any humans were around to witness them, how can we test the accuracy of phylogenetic methods? Biologists have conducted experiments both in living organisms and with computer simulations that have demonstrated the effectiveness and accuracy of phylogenetic methods.
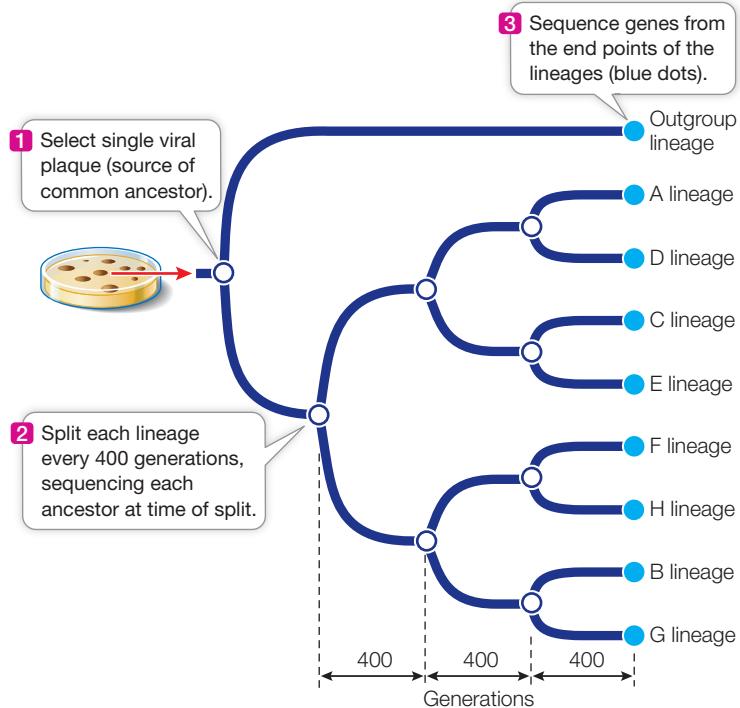
In one experiment designed to test the accuracy of phylogenetic analysis, a single viral culture of bacteriophage T7 was used as a starting point, and lineages were allowed to evolve from this ancestral virus in the laboratory (Investigating Life: Testing the Accuracy of Phylogenetic Analysis). The initial culture was split into two separate lineages, one of which became the ingroup for analysis and the other of which became the outgroup for rooting the tree. The lineages in the ingroup were split in two after every 400 generations,
Investigating Life: Testing the Accuracy of Phylogenetic Analysis
and samples of the virus were saved for analysis at each branching point. The lineages were allowed to evolve until there were eight lineages in the ingroup. Mutagens were added to the viral cultures to increase the mutation rate so that the amount of change and the degree of homoplasy would be typical of the organisms analyzed in average phylogenetic analyses. The investigators then sequenced samples from the end points of the eight ingroups and one outgroup lineages, as well as from the ancestors at the branching points. They then gave the sequences from the end points of the lineages to other investigators to analyze, without revealing the known history of the lineages or the sequences of the ancestral viruses.
Experiment
Original Paper: D. M. Hillis et al. 1992. Experimental phylogenetics: Generation of a known phylogeny. Science 255: 589–592.
To test whether analysis of gene sequences can accurately reconstruct evolutionary phylogeny, we must have an unambiguously known phylogeny to compare against the reconstruction. Will the observed phylogeny match the reconstruction?
HYPOTHESIS A phylogeny reconstructed by analyzing the DNA sequences of living organisms can accurately match the known evolutionary history of the organisms.
METHOD In the laboratory, researchers produced an unambiguous phylogeny of nine viral lineages, enhancing the mutation rate to increase variation among the lineages.
Viral sequences from the end points of each lineage (blue dots) were subjected to phylogenetic analysis by investigators who were unaware of the history of the lineages or the gene sequences of the ancestral viruses. These investigators reconstructed the phylogeny and ancestral DNA sequences based solely on their analyses of the descendants’ genomes.
RESULTS The true phylogeny and ancestral DNA sequences were accurately reconstructed solely from the DNA sequences of the viruses at the tips of the tree branches.
CONCLUSION Phylogenetic analysis of DNA sequences can accurately reconstruct evolutionary history.
Animation 20.1 Using Phylogenetic Analysis to Reconstruct Evolutionary History
Work with the Data
Original Paper: J. J. Bull et al. 1993. Experimental molecular evolution of bacteriophage T7. Evolution 47: 993–1007.
The full DNA sequences for the viral lineages produced in this experiment are thousands of nucleotides long. However, 23 of the nucleotide positions are shown in the table below, and you can use these data to repeat the researchers’ analysis. Each nucleotide position represents a separate character.
QUESTIONS
Construct a phylogenetic tree from the nucleotide positions using the parsimony principle (see Key Concept 20.2 and the examples in Table 20.1 and Figure 20.5). Use the outgroup to root your tree. Assume that all changes among nucleotides are equally likely.
Using your tree from Question 1, reconstruct the DNA sequences of the ancestral lineages.
Transitions are mutations that change one purine to the other (G ↔︎ A) or one pyrimidine to the other (C ↔︎ T), whereas transversions exchange a purine for a pyrimidine or vice versa (e.g., A → C or T; C → A or G). Which kind of mutation predominates in this phylogeny? Why might this be the case?
| Character at position | ||||||||||||||||||||||||
|---|---|---|---|---|---|---|---|---|---|---|---|---|---|---|---|---|---|---|---|---|---|---|---|---|
| Lineage | 1 | 2 | 3 | 4 | 5 | 6 | 7 | 8 | 9 | 10 | 11 | 12 | 13 | 14 | 15 | 16 | 17 | 18 | 19 | 20 | 21 | 22 | 23 | |
| A | T | C | G | G | G | C | C | C | C | C | C | C | A | A | C | C | G | A | T | A | C | A | A | |
| B | C | C | G | G | G | T | C | C | C | T | C | C | G | A | T | T | A | G | C | G | T | G | G | |
| C | C | C | G | G | G | C | C | C | C | C | C | C | C | A | A | C | C | G | G | T | A | C | A | A |
| D | T | C | A | G | G | C | C | C | C | C | C | C | C | A | A | C | C | G | A | T | A | C | A | A |
| E | C | T | G | G | G | C | C | C | C | C | C | C | T | A | A | C | C | G | G | T | A | C | A | A |
| F | C | T | G | A | A | C | C | C | C | C | C | C | G | A | C | T | G | G | C | G | C | G | G | |
| G | C | C | G | G | G | T | T | C | C | T | C | C | G | A | T | T | A | G | C | G | C | G | G | |
| H | C | C | G | G | A | C | C | C | C | C | C | C | G | C | C | C | T | G | G | C | G | C | G | G |
| Outgroup | C | C | G | G | G | C | C | T | C | C | C | T | C | G | A | C | C | G | G | C | A | C | G | G |
After the phylogenetic analysis was completed, the investigators asked two questions. Did phylogenetic methods reconstruct the known history correctly? And were the sequences of the ancestral viruses reconstructed accurately? The answer in both cases was yes. The branching order of the lineages was reconstructed exactly as it had occurred, more than 98% of the nucleotide positions of the ancestral viruses were reconstructed correctly, and 100% of the amino acid changes in the viral proteins were reconstructed correctly.
The experiment shown in Investigating Life: Testing the Accuracy of Phylogenetic Analysis demonstrated that phylogenetic analysis was accurate under the conditions tested, but it did not examine all possible conditions. Other experimental studies have taken other factors into account, such as the sensitivity of phylogenetic analysis to convergent environments and highly variable rates of evolutionary change. In addition, computer simulations based on evolutionary models have been used extensively to study the effectiveness of phylogenetic analysis. These studies have also confirmed the accuracy of phylogenetic methods and have been used to refine those methods and extend them to new applications.
Recap and Assess
Using the parsimony principle, phylogenetic trees are constructed to find the simplest explanation for evolutionary changes in traits among a set of organisms. Maximum likelihood methods incorporate more explicit mathematical models of evolutionary change to reconstruct evolutionary history. Laboratory tests and simulations have confirmed the general accuracy of phylogenetic methods.
The matrix below supplies data for seven land plants and an outgroup: an aquatic plant known as a stonewort. Each trait is scored as either present (+) or absent (-) in each of the plants.
| Taxon | Trait | |||||||
|---|---|---|---|---|---|---|---|---|
| Protected embryos | True roots | Persistently green sporophyte | Vascular cells | Stomata | True leaves | Seeds | ||
| sporophyte | ||||||||
| Stonewort (outgroup) | - | - | - | - | - | - | - | - |
| Liverwort | + | - | - | - | - | - | - | - |
| Pine tree | + | + | + | + | + | + | + | + |
| Bracken fern | + | + | + | + | + | + | + | - |
| Club moss | + | + | + | + | + | + | - | - |
| Sphagnum moss | + | - | - | - | - | + | - | - |
| Hornwort | + | - | + | - | - | + | - | - |
| Sunflower | + | + | + | + | + | + | + | + |
- Use the data matrix to reconstruct the phylogeny of land plants.
- Which two of these taxa are most closely related?
- Plants that produce seeds are known as seed plants. What is the sister group to the seed plants among these taxa?
- Which two traits evolved along the same branch of your reconstructed phylogeny?
- Are there any homoplasies in your reconstructed phylogeny?
Why do biologists expend the time and effort necessary to reconstruct phylogenies? Information about the evolutionary relationships among organisms is a useful source of data for scientists investigating a wide variety of biological questions. Next we will describe how phylogenetic trees are used to answer questions about the past, and to predict and compare traits of organisms in the present.
Phylogeny Makes Biology Comparative and Predictive
Learning Objectives
20.3.1 Formulate a hypothesis about the origin of an epidemic using a phylogenetic tree.
20.3.2 Calculate the rate of a molecular clock from a graph that shows changes over time.
Once a phylogeny is reconstructed, what do we do with it? What else, beyond an understanding of evolutionary history, does phylogeny offer us?
Phylogenetic trees can be used to reconstruct past events
Reconstructing past events is important for understanding many biological processes. In the case of zoonotic diseases (diseases caused by infectious organisms transmitted to humans from another animal host), it is important to understand when, where, and how the disease first entered a human population. Human immunodeficiency virus (HIV) is the cause of such a zoonotic disease, acquired immunodeficiency syndrome, or AIDS. Phylogenetic analyses have become important for studying the transmission of viruses such as HIV. Phylogenies are also important for understanding the present global diversity of HIV and for determining the virus’s origins in human populations. A broader phylogenetic analysis of immunodeficiency viruses shows that humans acquired these viruses from two different hosts: HIV-1 from common chimpanzees (Pan troglodytes), and HIV-2 from sooty mangabeys (Cercocebus atys) (Figure 20.7).
HIV-1 is the common form of the virus in human populations in central Africa, where chimpanzees are hunted for food, and HIV-2 is the common form in human populations in western Africa, where sooty mangabeys are hunted for food. Thus it seems likely that these viruses entered human populations through hunters who cut themselves while skinning chimpanzees and sooty mangabeys. The global pandemic of AIDS occurred when these infections in local African populations rapidly spread through human populations around the world.
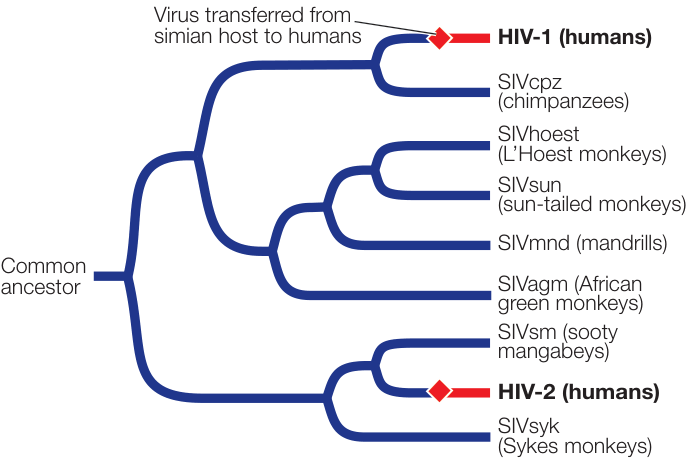
Figure 20.7 Phylogenetic Tree of Immunodeficiency Viruses The evolutionary relationships of immunodeficiency viruses show that these viruses have been transmitted to humans from two different simian hosts: HIV-1 from common chimpanzees and HIV-2 from sooty mangabeys. (SIV stands for simian immunodeficiency virus.) (After B. Hahn et al. 2000. Science 287: 607–614.)
In recent years, phylogenetic analysis has become important in forensic investigations that involve viral transmission events. For example, phylogenetic analysis was critical for a criminal investigation of a physician who was accused of purposefully injecting blood from one of his HIV-positive patients into his former girlfriend in an attempt to kill her. The phylogenetic analysis revealed that the HIV strains present in the girlfriend were a subset of those present in the physician’s patient (Figure 20.8). Other evidence was needed, of course, to connect the physician to this purposeful transmission event, but the phylogenetic analysis was important to support the viral transmission event from the patient to the victim.
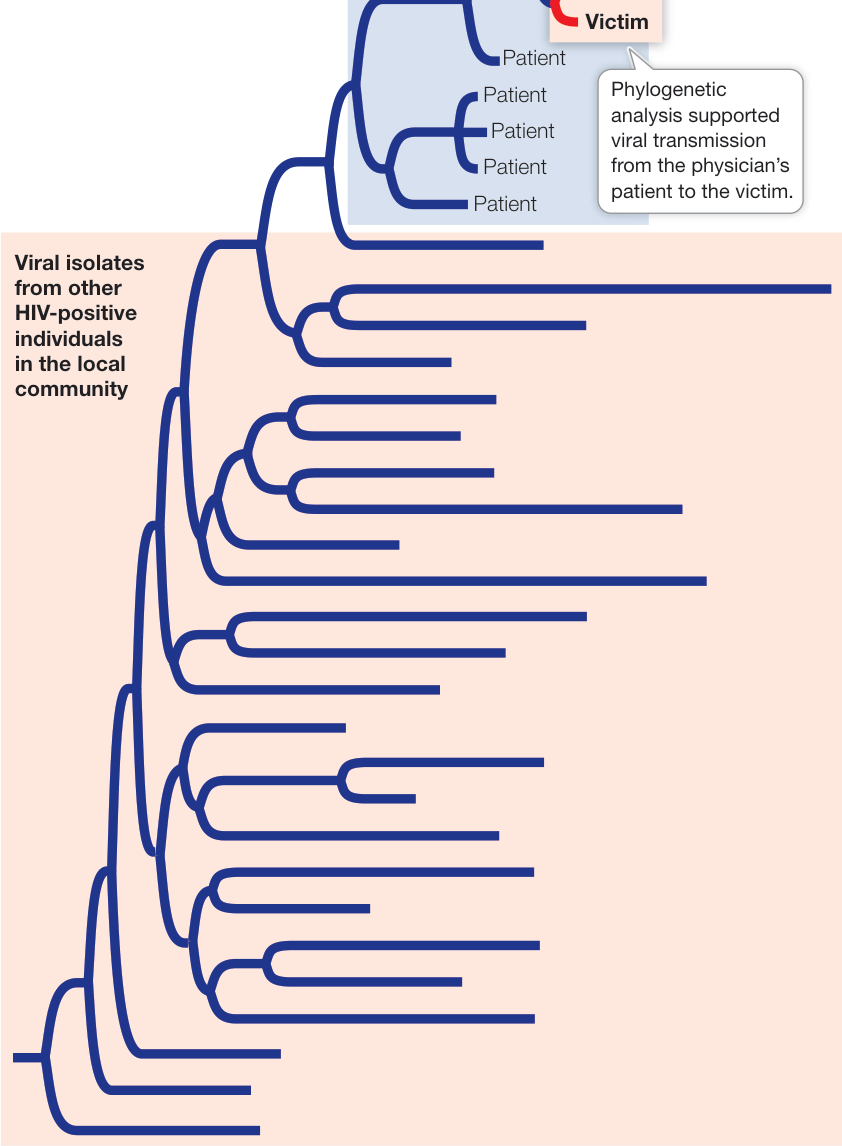
Figure 20.8 A Forensic Application of Phylogenetic Analysis This phylogenetic analysis demonstrated that strains of HIV present in a victim (shown in red) were a phylogenetic subset of viruses isolated from a physician’s patient (shown in blue). This analysis was part of the evidence used to show that the physician drew blood from his HIV-positive patient and injected it into the victim in an attempt to kill her. A jury found the physician guilty of attempted murder. (After M. Metzker et al. 2002. Proc Natl Acad Sci USA 99: 14292–14297. © 2002 National Academy of Sciences, U.S.A.) Q: What hypothetical phylogenetic results could have exonerated the physician?
Phylogenies allow us to compare and contrast living organisms
Male swordtails—a group of fishes in the genus Xiphophorus—have a long, colorful tail extension, and their reproductive success is closely associated with this appendage. Males with a long sword are more likely to mate successfully than are males with a short sword (an example of sexual selection; see Key Concept 19.2). Several explanations have been advanced for the evolution of this structure, including the hypothesis that the sword simply exploits a preexisting bias in the sensory system of the females. This sensory exploitation hypothesis suggests that female swordtails had a preference for males with long tails even before the tails evolved (perhaps because females assess the size of males by their total body length—including the tail—and prefer larger males).
To test the sensory exploitation hypothesis, phylogenetic analysis was used to identify the relatives of swordtails that had split most recently from their lineage before the evolution of swords. These closest relatives turned out to be fishes in the genus Priapella. Even though male Priapella do not normally have swords, when researchers attached artificial swordlike structures to the tails of male Priapella, female Priapella preferred those males. This result provided support for the hypothesis that female Xiphophorus had a preexisting sensory bias favoring tail extensions even before the trait evolved (Figure 20.9). Thus a long tail became a sexually selected trait because of the preexisting preference of the females. The phylogeny allows us to understand when the trait evolved relative to the change in female preference.
Phylogenies can reveal convergent evolution
Like most animals, flowering plants (angiosperms) often reproduce by mating with another individual of the same species. But in many angiosperm species, the same individual produces both male and female gametes (contained within pollen and ovules, respectively). Self-incompatible species have mechanisms to prevent fertilization of the ovule by the individual’s own pollen, and so must reproduce by outcrossing with another individual. Individuals of some species, however, regularly fertilize their ovules using their own pollen; they are self-fertilizing or selfing species, and their gametes are self-compatible.
Connect the Concepts Self-incompatibility in plants depends on a plant’s ability to determine whether pollen is genetically different than its own pollen. How a plant does this is discussed in Key Concept 36.1.
The evolution of angiosperm fertilization mechanisms was examined in Leptosiphon, a genus in the phlox family that exhibits a diversity of mating systems and pollination mechanisms. The self-incompatible (outcrossing) species of Leptosiphon have long petals and are pollinated by long-tongued flies. In contrast, self-pollinating species have short petals and do not require insect pollinators to reproduce successfully. Using ribosomal DNA sequences, investigators reconstructed a phylogeny of this genus (Figure 20.10). They then determined whether each species was self-compatible by artificially pollinating flowers with the plant’s own pollen or with pollen from other individuals and observing whether viable seeds formed.
The reconstructed phylogeny suggests that self-incompatibility is the ancestral state and that self-compatibility evolved three times within this group of Leptosiphon. The change to self-compatibility eliminated the plants’ dependence on an outside pollinator and has been accompanied by the evolution of reduced petal size. Indeed, the striking morphological similarity of the flowers in the self-compatible groups once led to their being classified as members of a single species (L. bicolor). Phylogenetic analysis, however, shows them to be members of three distinct lineages. From this information we can infer that self-compatibility and its associated floral structure are convergent in the three independent lineages that had been called L. bicolor.
Ancestral states can be reconstructed
In addition to using phylogenetic methods to infer evolutionary relationships, biologists can use these techniques to reconstruct the morphology, behavior, or nucleotide and amino acid sequences of ancestral species (as was demonstrated for the ancestral sequence of bacteriophage T7 in Investigating Life: Testing the Accuracy of Phylogenetic Analysis). In the opening of this chapter, we described how Mikhail Matz used phylogenetic analysis to reconstruct the sequence of changes in fluorescent proteins of corals to understand how red fluorescent proteins could be produced.
Reconstruction of ancient DNA sequences can also provide information about the biology of long-extinct organisms. For example, phylogenetic analysis was used to reconstruct an opsin protein in the ancestral archosaur (the most recent common ancestor of birds, dinosaurs, and crocodiles). Opsins are pigment proteins involved in vision; different opsins (with different amino acid sequences) are excited by different wavelengths of light. Knowledge of the opsin sequence in the ancestral archosaur would provide clues about the animal’s visual capabilities and therefore about some of its probable behaviors. Investigators used phylogenetic analysis of opsin from living vertebrates to estimate the amino acid sequence of the pigment that existed in the ancestral archosaur. A protein with this same sequence was then constructed in the laboratory. The investigators tested the reconstructed opsin and found a significant shift toward the red end of the spectrum in the light sensitivity of this protein compared with that of most modern opsins. Modern species that exhibit similar sensitivity are adapted for nocturnal vision, so the investigators inferred that the ancestral archosaur might have been active at night. Thus, reminiscent of the movies
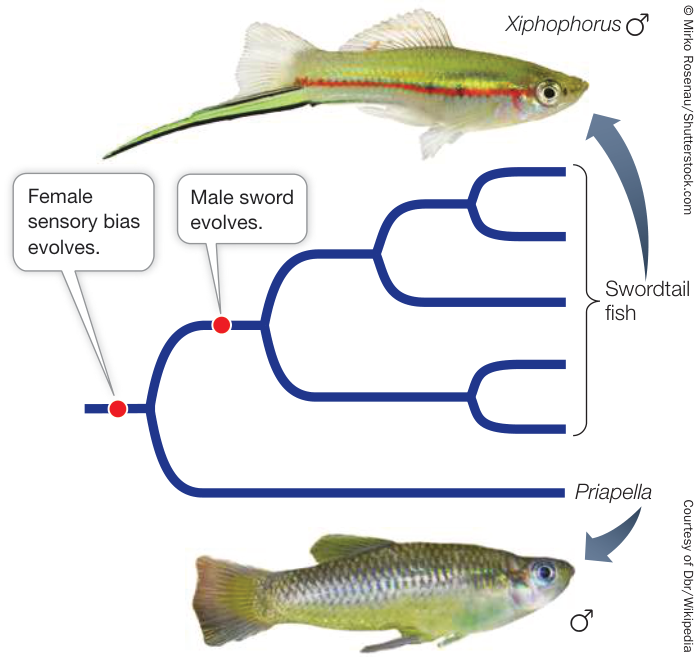
Figure 20.9 The Origin of a Sexually Selected Trait The tail extension of male swordtails (genus Xiphophorus) apparently evolved through sexual selection, as females mated preferentially with males that had long “swords.” Phylogenetic analysis reveals that Priapella split from the swordtails before the evolution of the sword. The independent finding that female Priapella prefer male Priapella with an artificial sword further supports the idea that this appendage evolved as a result of a preexisting preference in females. (After A. L. Basolo. 1995. Proc R Soc Lond B Biol Sci 259: 307–311.)
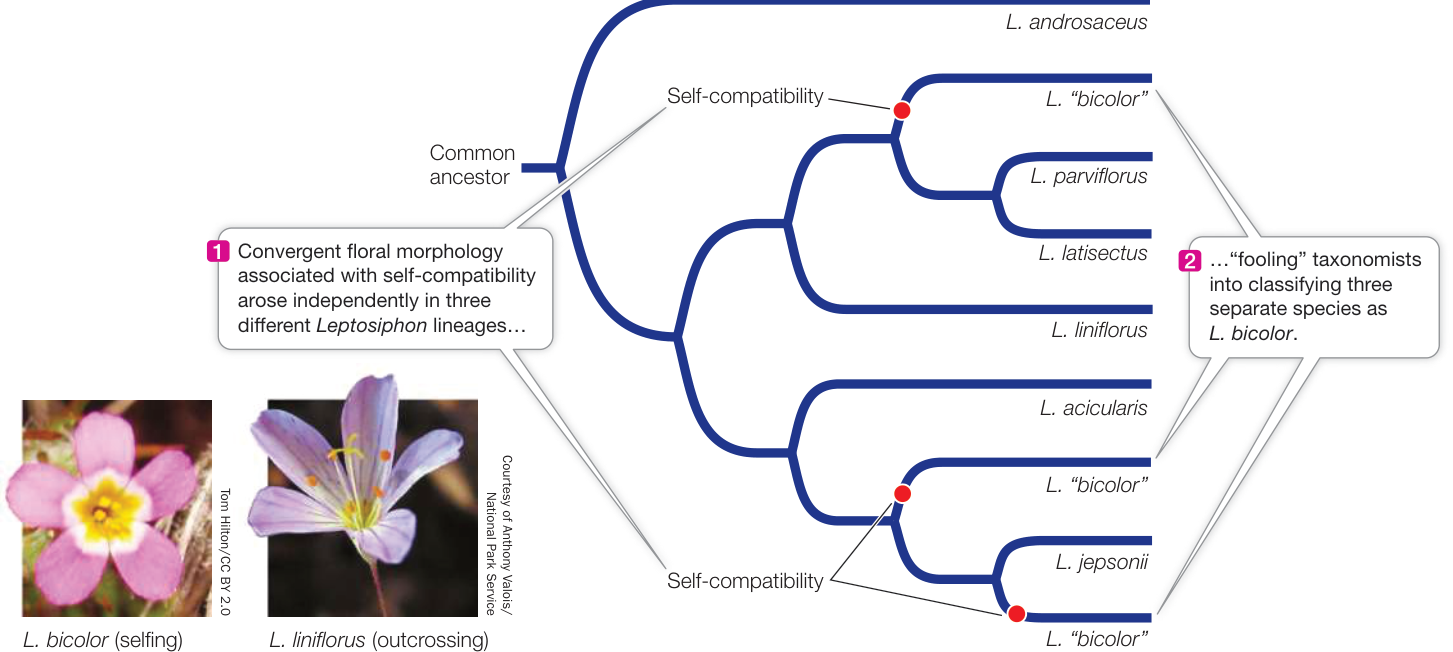
Figure 20.10 Phylogeny Reveals Convergent Evolution Self-compatibility apparently evolved independently three times among these species of the plant genus Leptosiphon. Because the appearance and structure of the flowers converged in the three selfing lineages, taxonomists mistakenly thought they were varieties of the same species. (After K. E. Holsinger. 2000. Proc Natl Acad Sci USA 97: 7037–7042. © 2000 National Academy of Sciences, U.S.A.)
Jurassic Park and Jurassic World, phylogenetic analyses are being used to reconstruct extinct species, one protein at a time.
Molecular clocks help date evolutionary events
For many applications, biologists want to know not only the order in which evolutionary lineages split but also the timing of those splits. In 1965, Emile Zuckerkandl and Linus Pauling hypothesized that rates of molecular change were constant enough that they could be used to predict evolutionary divergence times—an idea that has become known as the molecular clock hypothesis.
Of course, different genes evolve at different rates, and there are also differences in evolutionary rates among species associated with differing generation times, environments, efficiencies of DNA repair systems, and other biological factors. Nonetheless, among closely related species, a given gene usually evolves at a reasonably constant rate. Therefore the protein encoded by the gene accumulates amino acid replacements at a relatively constant rate (Figure 20.11). A molecular clock uses the average rate at which a given gene or protein accumulates changes to gauge the time of divergence for a particular split in the phylogeny. Molecular clocks must be calibrated using independent data, such as the fossil record, known times of divergence, or biogeographic dates (e.g., the time of separations of continents). Using such calibrations, times of divergence have been estimated for many groups of species that have diverged over millions of years.
Molecular clocks are not only used to date ancient events; they are also used to study the timing of comparatively recent events. Most samples of HIV-1 have been collected from humans only since the early 1980s, although a few isolates from medical biopsies are available from as early as the 1950s. Biologists can use the observed changes in HIV-1 over the past several decades to project back to the common ancestor of all HIV-1 isolates, and estimate when HIV-1 first entered human populations from chimpanzees (Figure 20.12). This molecular clock was calibrated using the samples from the 1980s and 1990s, and then tested using the samples from the 1950s. As shown in Figure 20.12C, a sample from a 1959 biopsy is dated by molecular clock analysis at years. Extrapolation back to the common ancestor of the samples suggested a date of origin for this group of viruses of about 1930. Although AIDS was unknown to Western medicine until the 1980s, this analysis shows that HIV-1 was present (probably at a very low frequency) in human populations in Africa for at least a half-century before its emergence as a global pandemic. Biologists have used similar analyses to conclude that immunodeficiency viruses have been transmitted repeatedly into human populations from multiple primates for more than a century (see also Figure 20.7).
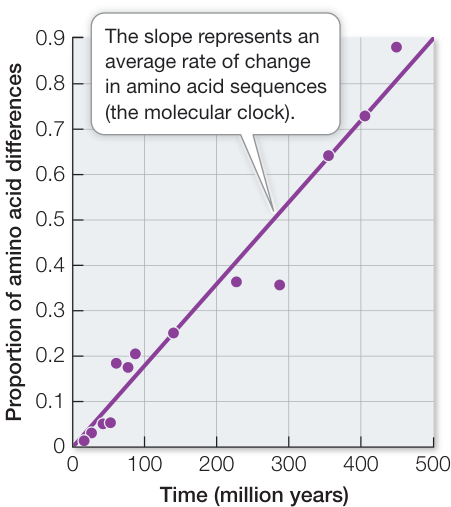
Figure 20.11 A Molecular Clock for the Protein Hemoglobin Amino acid replacements in hemoglobin have occurred at a relatively constant rate over nearly 500 million years of evolution. The graph shows the relationship between the time of divergence and the proportion of amino acids that have changed for 13 pairs of vertebrate hemoglobin proteins. The average rate of change represents the molecular clock for hemoglobin in vertebrates. (After R. E. Dickerson. 1971. J Mol Evol 1: 26–45.)
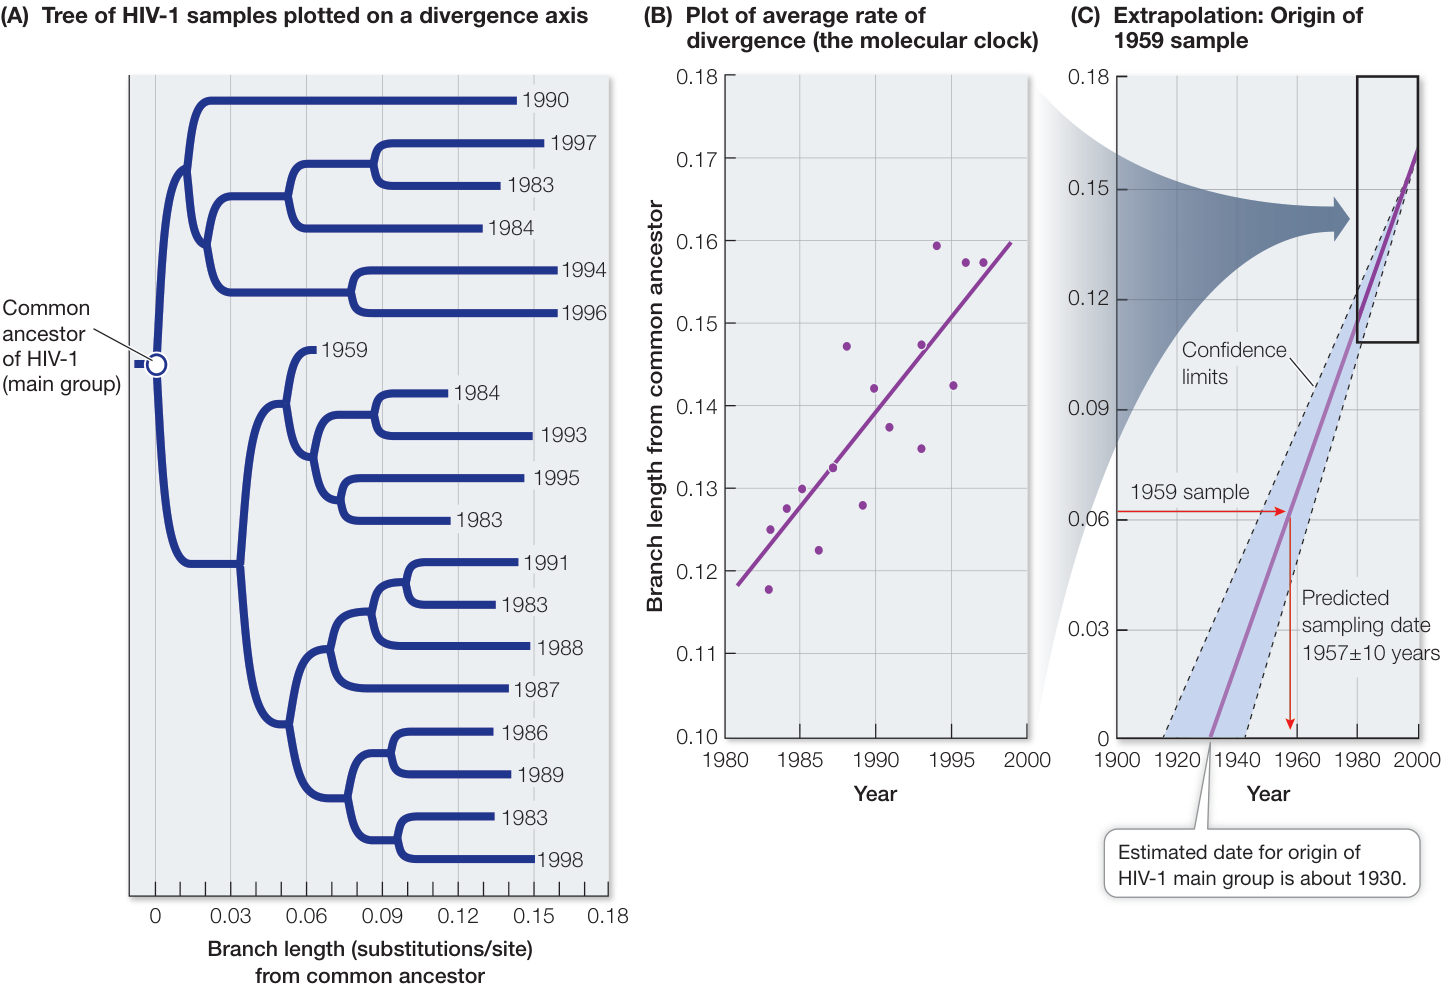
Figure 20.12 Dating the Origin of HIV-1 in Human Populations (A) A phylogenetic tree for samples of the main group of HIV-1 virus. The dates indicate the years in which the samples were taken. (For clarity, only a small fraction of the samples that were examined in the original study are shown.) (B) A plot of sample year versus genetic divergence from the common ancestor provided an average rate of divergence, or a molecular clock. (C) The molecular clock was used to date a sample taken in 1959 (as a test of the clock) and to estimate the date of origin of the HIV-1 main group (about 1930). Branch length from a common ancestor represents the average number of substitutions per nucleotide; the blue shaded region indicates the 95% confidence limits of the molecular clock predictions. (After B. Korber et al. 2000. Science 288: 1789–1796.) Q: What would be the expected branch length from the common ancestor of an HIV isolate from 1970?
Recap and Assess
Phylogenetic trees are used to reconstruct the evolutionary history of lineages, to determine when and where traits arose, and to make biological comparisons among genes, populations, and species. They can also be used to reconstruct ancestral traits and to estimate the timing of evolutionary events.
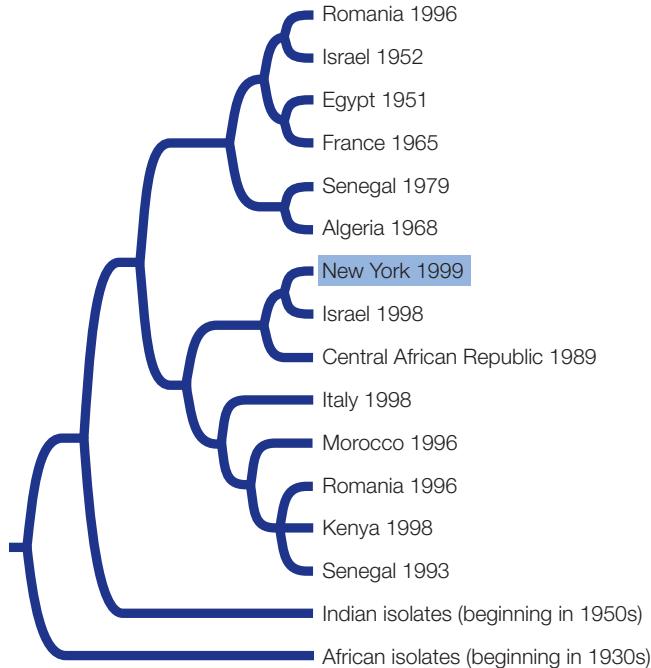
- West Nile virus kills birds of many species and can cause fatal encephalitis (inflammation of the brain) in humans and horses. In the 1930s the virus was first isolated in Africa, where it is thought to be endemic. By the 1990s it had been found throughout much of Eurasia. West Nile virus was not found in North America until 1999, when it was first detected in New York, but since that time it has spread rapidly across most of the United States. Use the phylogenetic tree of West
Nile virus isolates shown here to construct a hypothesis about the origin of the virus lineage that was introduced into the United States (figure source: R. S. Lanciotti et al. 1999. Science 1286: 2333–2337). The isolates are identified by their place and date of isolation.
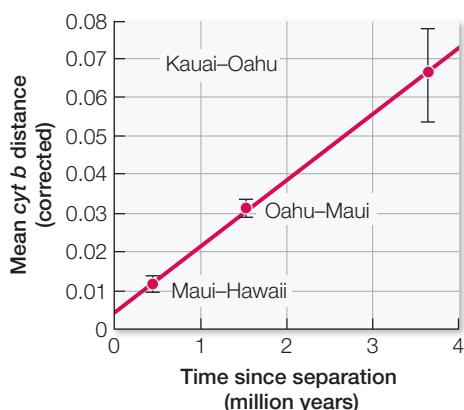
- Researchers examined the molecular divergence of a mitochondrial DNA gene (cyt b) among sister species of birds called honeycreepers on different islands of Hawaii. They then plotted the measured molecular divergence against the estimated dates for separation of the islands (figure source: R. C. Fleischer et al. 1998. Mol Ecol 7: 533–545; bars represent 95% confidence limits for the estimated molecular divergences). Calculate the average rate of change in cyt b (the molecular clock) from the graph.
All of life is connected through evolutionary history, and the relationships among organisms provide a natural basis for making biological comparisons. For these reasons, biologists use phylogenetic relationships as the basis for organizing life into a coherent classification system.
Phylogeny Is the Basis of Biological Classification
Learning Objectives
20.4.1 Use a phylogeny to classify a group of organisms. 20.4.2 Analyze a phylogenetic tree to identify monophyletic, polyphyletic, and paraphyletic groups.
The biological classification system in widespread use today is derived from a system developed by the Swedish biologist Carolus Linnaeus in the mid-1700s. Linnaeus developed a naming system called binomial nomenclature that has allowed scientists throughout the world to refer unambiguously to the same organisms by the same names.
Linnaean classification is based on standard taxon ranks
Linnaeus gave each species a two-part name, one part identifying the species itself and the other the genus to which it belongs. A genus (plural genera) is a group of closely related species. Optionally, the name of the taxonomist who first proposed the species name may be added at the end. Thus Homo sapiens Linnaeus is the name of the modern human species. Homo is the genus to which the species belongs, and sapiens identifies the particular species in the genus Homo; Linnaeus proposed the species name Homo sapiens.
You can think of Homo as equivalent to your surname and sapiens as equivalent to your first name. The first letter of the genus name is capitalized, and the specific name is lowercase. Both of these formal designations are italicized. Rather than repeating the name of a genus when it is used several times in the same discussion, biologists often spell it out only once and abbreviate it with the initial letter thereafter (e.g., D. melanogaster rather than Drosophila melanogaster).
As we noted earlier, any group of organisms that is treated as a unit in a biological classification system, such as all species in the genus Drosophila, or all insects, or all arthropods, is called a taxon. In the Linnaean system, species and genera are further grouped into a hierarchical system of higher taxonomic categories. The taxon above the genus in the Linnaean system is the family. The names of animal families end in the suffix “-idae.” Thus Formicidae is the family that contains all ant species, and the family Hominidae contains humans and our recent fossil relatives, as well as orangutans, gorillas, and our closest living relatives, the chimpanzees. Family names are based on the name of a member genus; Formicidae is based on the genus Formica, and Hominidae is based on Homo. The same rules are used in classifying plants, except that the suffix “-aceae” is used for plant family names instead of “-idae.” Thus Rosaceae is the family that includes the genus Rosa (roses) and its relatives.
In the Linnaean system, families are grouped into orders, orders into classes, classes into phyla (singular phylum), and phyla into kingdoms. However, the ranking of taxa within Linnaean classification is subjective. Whether a particular taxon is considered, say, an order or a class is informative only with respect to the relative ranking of other related taxa. Although families are always grouped within orders, orders within classes, and so forth, there is nothing that makes a “family” in one group equivalent (in number of genera or in evolutionary age, for instance) to a “family” in another group.
Linnaeus recognized the overarching hierarchy of life, but he developed his system before evolutionary thought had become widespread. Biologists today recognize the tree of life as the basis for biological classification and often name taxa without placing them into the various Linnaean ranks.
Evolutionary history is the basis for modern biological classification
Today’s biological classifications express the evolutionary relationships of organisms. Taxa are expected to be monophyletic, meaning that the taxon contains an ancestor and all descendants of that ancestor, and no other organisms. In other words, a monophyletic taxon is a historical group of related species, or a complete branch on the tree of life. As noted earlier, this is also the definition of a clade. A true monophyletic group can be removed from a phylogenetic tree by a single “cut” in the tree, as shown in Figure 20.13.
Note that there are many monophyletic groups on any phylogenetic tree, and that these groups are successively smaller subsets of larger monophyletic groups. This hierarchy of biological taxa, with all of life as the most inclusive taxon and many smaller taxa within larger taxa, down to the individual species, is the modern basis for biological classification.
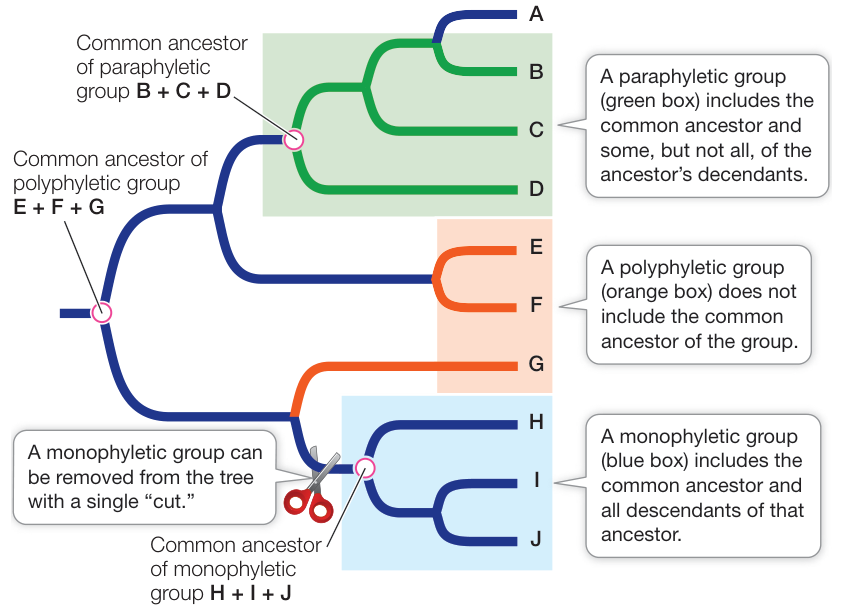
Figure 20.13 Monophyletic, Polyphyletic, and Paraphyletic Groups Monophyletic groups are the basis of taxa in modern biological classifications. Polyphyletic and paraphyletic groups are not appropriate for use in classifications because they do not accurately reflect evolutionary history.
Although biologists seek to describe and name only monophyletic taxa, the detailed phylogenetic information needed to do so is not always available. A group that does not include its common ancestor is polyphyletic. A group that does not include all the descendants of a common ancestor is referred to as paraphyletic (see Figure 20.13). Virtually all taxonomists now agree that polyphyletic and paraphyletic groups are inappropriate as taxonomic units because they do not correctly reflect evolutionary history. Some classifications still contain such groups because some organisms have not been evaluated phylogenetically. As mistakes in prior classifications are detected, taxonomic names are revised and polyphyletic and paraphyletic groups are eliminated from the classifications.
Several codes of biological nomenclature govern the use of scientific names
Several sets of explicit rules govern the use of scientific names. Biologists around the world follow these rules voluntarily to facilitate communication and dialogue. There may be dozens of common names for an organism in many different languages, and the same common name may refer to more than one species (Figure 20.14). The rules of biological nomenclature are designed so that there is only one correct scientific name for any single recognized taxon, and (ideally) a given scientific name applies only to a single taxon (that is, each scientific name is unique). Sometimes the same species is named more than once (when more than one taxonomist has taken up the task). In these cases, the rules specify that the valid name is the first name that was proposed. If the same name is inadvertently given to two different species, then the species that was named second must be given a new name.
Because of the historical separation of the fields of zoology, botany (which originally included mycology, the study of fungi), and microbiology, different sets of taxonomic rules were developed for each of these groups. Yet another set of rules emerged later for classifying viruses. This separation of fields resulted in duplicated taxon names in groups governed by the different sets of rules. Drosophila, for example, is both a genus of fruit flies and a genus of fungi, and some species in both groups have identical names. Until recently these duplicated names caused little confusion, since traditionally biologists who studied fruit flies were unlikely to read the literature on fungi (and vice versa). Today, given the prevalence of large, universal biological databases (such as GenBank, which includes DNA sequences from across all life), it is increasingly important that each taxon have a unique and unambiguous name. Biologists are working on a universal code of nomenclature that can be applied to all organisms, so that every species will have a unique identifying name or registration number. This will assist efforts to build an online Encyclopedia of Life (eol.org) that links all the information for all the world’s species.
Phylogenetic methods are used by biologists to compare the evolutionary relationships across all of life and to study many evolutionary processes. In Chapter 21 we will use phylogenies as one of several tools to understand evolution at the level of genes and genomes.
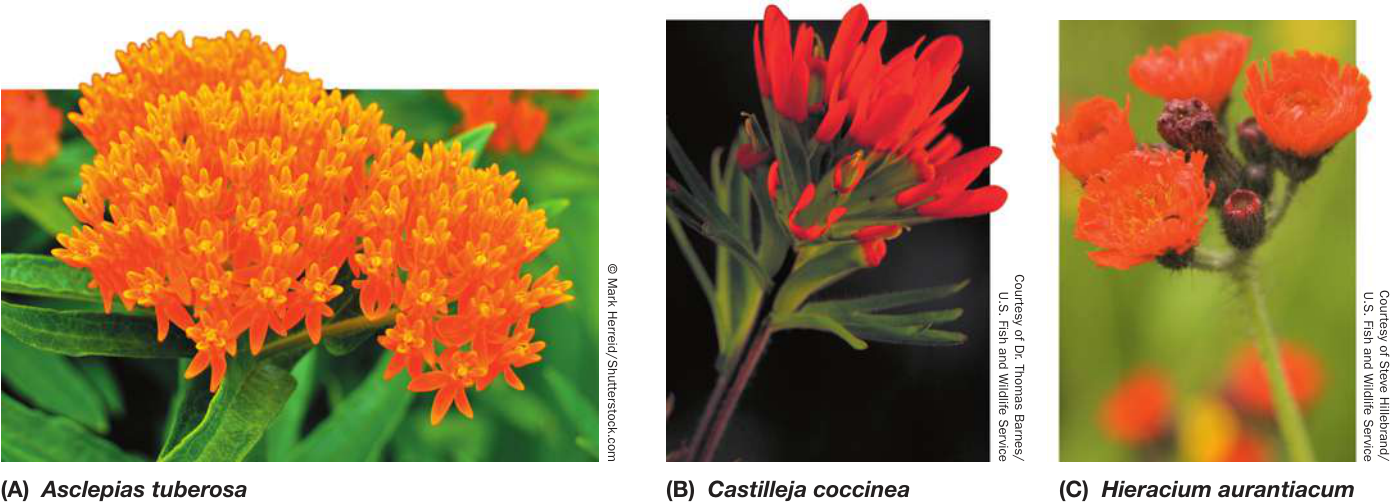
Figure 20.14 Same Common Name, Not the Same Species All three of these distinct plant species are called “Indian paint-brush.” Binomial nomenclature allows us to avoid the ambiguity of such common names and communicate exactly what is being described. (A) Asclepias tuberosa is a perennial milkweed native to eastern North America. (B) Castilleja coccinea is also native to eastern North America, but is a member of a very different group of plants called scrophs. (C) Hieracium aurantiacum is a European species of aster that has been widely introduced into North America.
Recap and Assess
Biologists organize and classify life by identifying and naming monophyletic groups. Several sets of rules govern the use of scientific names so that each species and higher taxon can be identified and named unambiguously.
Consider the phylogeny and three possible classifications shown here.
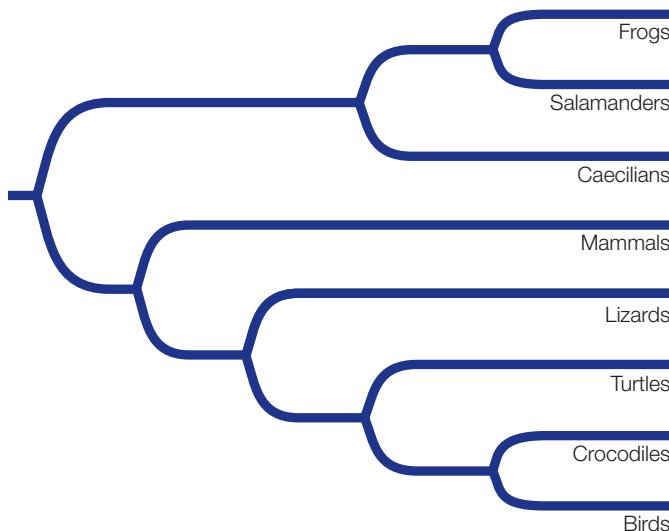
Classification one:
| Named group | Included taxa |
|---|---|
| Amphibia | Frogs, salamanders, and caecilians |
| Mammalia | Mammals |
| Reptilia | Lizards, turtles, and crocodiles |
| Aves | Birds |
Classification two:
| Named group | Included taxa |
|---|---|
| Amphibia | Frogs, salamanders, and caecilians |
| Mammalia | Mammals |
| Reptilia | Lizards, turtles, crocodiles, and birds |
Classification three:
| Named group | Included taxa |
|---|---|
| Amphibia | Frogs, salamanders, and caecilians |
| Homothermia | Mammals and birds |
| Reptilia | Lizards, turtles, and crocodiles |
- Which of these classifications contains a paraphyletic group?
- Which of these classifications contains a polyphyletic group?
- Which of these classifications is consistent with the goal of including only monophyletic groups in a biological classification?
Investigating Life: QA How are phylogenetic methods used to resurrect protein sequences from extinct organisms?
Most genes and proteins of organisms that lived millions of years ago have decomposed in the fossil remains of these species. Nonetheless, the sequences of many ancient genes and proteins can be reconstructed by the methods described in this chapter. As we saw in Investigating Life: Testing the Accuracy of Phylogenetic Analysis, we can reconstruct ancestral DNA sequences—if we have enough information about the genomes of their descendants. Biologists have reconstructed gene sequences from species that have been extinct for millions of years. Using this information, a laboratory can reconstruct real proteins that correspond to those gene sequences. This is how Mikhail Matz and his colleagues were able to resurrect fluorescent proteins from the extinct ancestors of modern corals, then visualize the colors produced by these proteins in the laboratory (Figure 20.15).
Future directions
Biologists are now using phylogenetic analysis to reconstruct many ancient protein sequences. These reconstructed protein sequences are then made into actual proteins in the laboratory. For example, when biologists measured the temperature optima for resurrected proteins that were present in the common ancestor of all life, they found that the proteins functioned best in the range of 55°C–65°C. This result is consistent with hypotheses that life evolved in a high-temperature environment.
To reconstruct protein sequences from species that have been extinct for millions or even billions of years, biologists use detailed mathematical models that take into account much of what we have learned about molecular evolution, as described in Key Concept 20.2. These models incorporate information on rates of replacement among different amino acids in proteins, information on different substitution rates among nucleotides, and changes in the rate of molecular evolution among the major lineages of life. These studies are opening up opportunities to see how proteins have evolved through time and how extinct species once functioned.
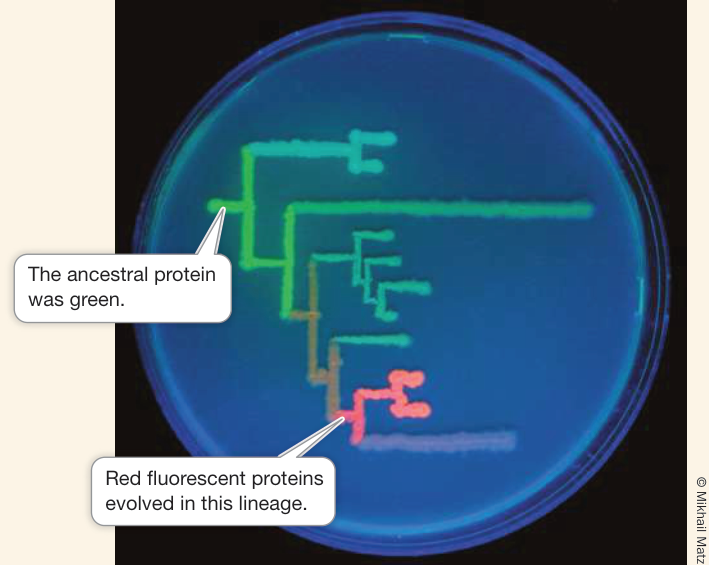
Figure 20.15 Evolution of Fluorescent Proteins of Corals Mikhail Matz and his colleagues used phylogenetic analysis to reconstruct the sequences of fluorescent proteins that were present in the extinct ancestors of modern corals. They then expressed these proteins in bacteria and plated the bacteria in the form of a phylogenetic tree to show how the colors evolved over time.


© Martin Harvey/Alamy Stock Photo
You should be able to relate each summary to the adjacent figures. If you go to this visual summary in Achieve, you can follow links to figures, animations, activities, and simulations that will help you consolidate the material.
Visual Summary
All of Life Is Connected through Its Evolutionary History
- ■ Phylogeny is the history of evolutionary relationships among organisms or their genes. Groups of evolutionarily related species are represented as branches in a phylogenetic tree.
- ■ Named species and groups of species are called taxa. A taxon that consists of an ancestor and all of its evolutionary descendants is called a clade. Homologies are similar traits that have been inherited from a common ancestor.
- ■ A derived trait that is shared by two or more taxa and is inherited from their common ancestor is called a synapomorphy. Distantly related species may show similar traits that do not result from common ancestry. Convergent evolution and evolutionary reversals can give rise to such traits, which are called homoplasies.
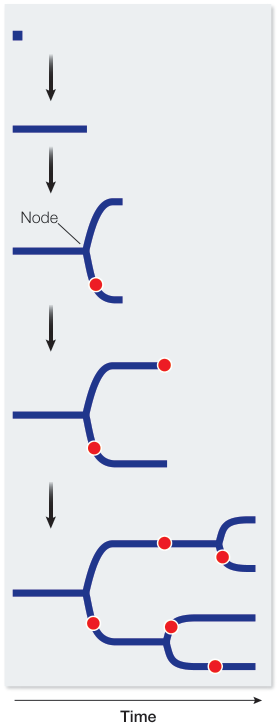
Figure 20.1
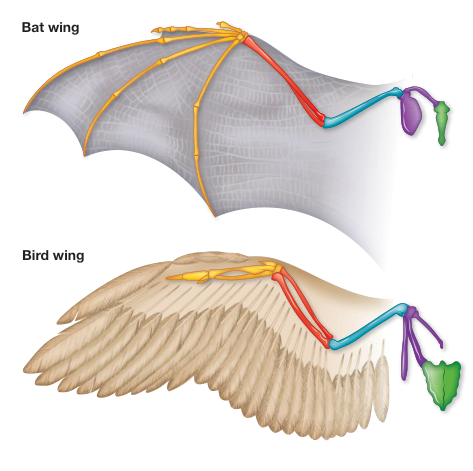
Figure 20.4 Questions
- Draw a phylogenetic tree of humans, chimpanzees, gorillas, and orangutans. Label the root and nodes.
- What does the root of the tree represent?
- What do the nodes represent?
Phylogeny Can Be Reconstructed from Traits of Organisms
- ■ Phylogenetic trees can be constructed from synapomorphies using the parsimony principle.
- ■ Phylogenetic trees can also be constructed using maximum likelihood methods, which find the tree most likely to have generated the observed data under a specific model of evolution.
- ■ Phylogenetic methods have been tested in both experimental and simulation studies, and have been shown to be accurate under a wide variety of conditions.
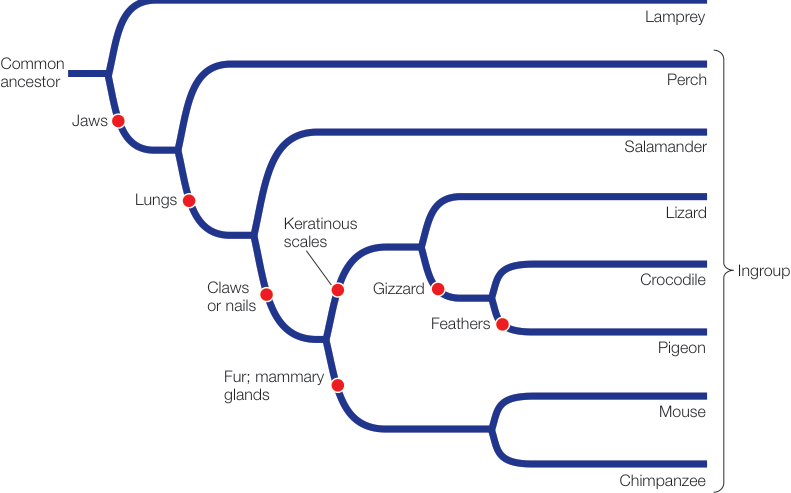
Figure 20.5 Questions
- What does the parsimony method minimize?
- What is an example of a synapomorphy?
- Why is it important that phylogenetic characters are genetically determined, rather than being influenced by the organism’s environment?
Phylogeny Makes Biology Comparative and Predictive
- ■ Phylogenetic trees are used to make comparisons among living organisms.
- ■ Phylogenetic trees are used to reconstruct the past and to understand the origin of traits.
- ■ Phylogenetic trees may include estimates of divergence times of lineages determined by molecular clock analysis.
Questions
- Draw a phylogenetic tree of HIV-1, HIV-2, and related SIVs from other primates.
- Use the tree of HIVs and SIVs to explain the multiple origins of HIV in human populations.
- How can phylogenetic trees be used to date at least one origin of HIV in humans?
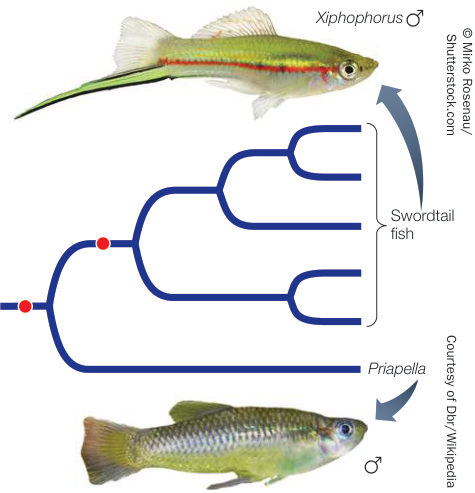
Figure 20.9
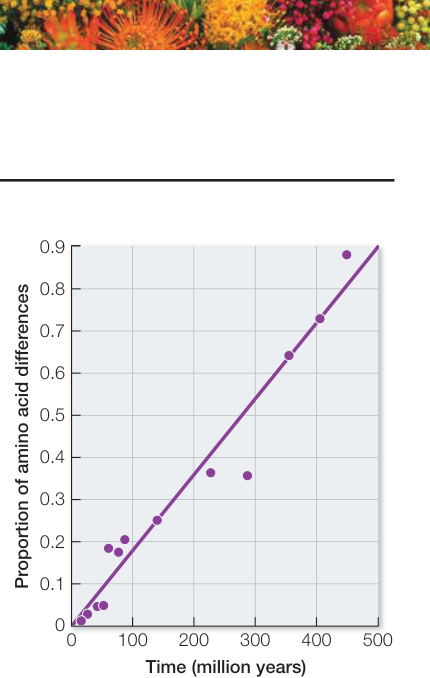
Figure 20.11
Phylogeny Is the Basis of Biological Classification
- ■ Biologists use phylogenetic relationships to organize life into a coherent classification system.
- ■ Taxa in modern classifications are expected to be monophyletic groups. Paraphyletic and polyphyletic groups are not considered appropriate taxonomic units.
- ■ Several sets of rules govern the use of scientific names, with the goal of providing unique and universal names for taxa.
Questions
- Draw a phylogenetic tree, with taxon labels A–F.
- Label a monophyletic group and a paraphyletic group on the tree.
- What are the advantages of scientific names for taxa, as compared with common names?
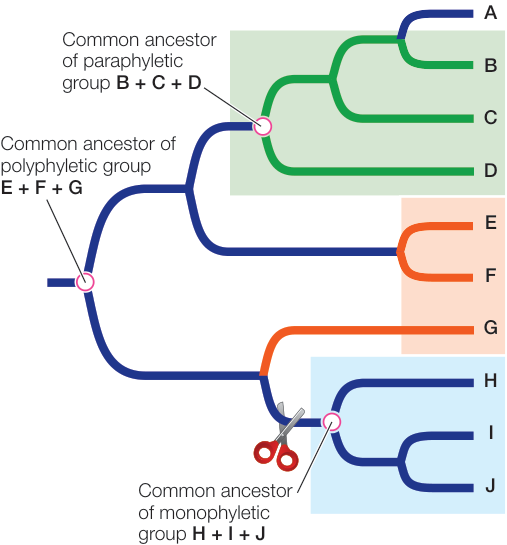
Figure 20.13