Exam

Your answers are saved in this browser. Check them against the downloaded answer key, or open the explanation when you are ready.

Question 1

Question 1 is worth a total of 7 points.
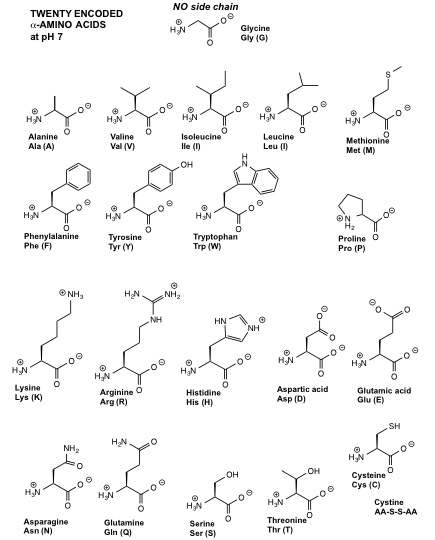
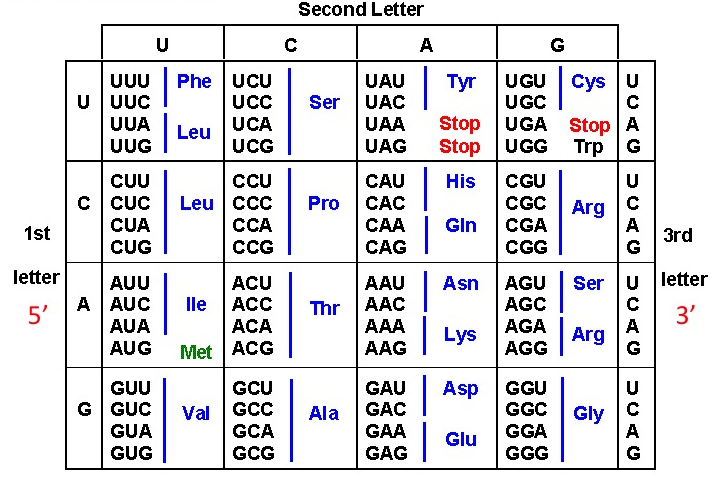
There is a codon chart and an amino acid reference table at the bottom of this page.

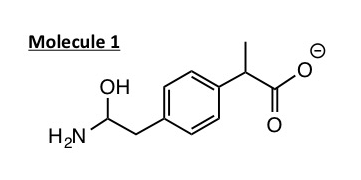
The following is the line angle drawing of Molecule 1.
Question 1a, part i

Label the positions of the carbon atoms on the line angle drawing of Molecule 1. (Note: you need not label all the carbons, just the ones with drag and drop boxes available.)

Choose a numbered location for each label. Leave unused labels as “Not placed.”

The line angle diagram of an organic molecule.123456789
Show reference answer

This archived key gives example locations for repeated labels. It does not show a complete placement.

  • C: location 9

Question 1a, part ii

Now, identify how many hydrogens are bound to each carbon. Drag and drop an icon with the correct number of H's over each of the carbon atoms on the figure. (Only place icons onto the carbons you identified in the problem above, Question 1a, part i. Do NOT add hydrogens to where they are already labeled. You may not need to use all the icons provided.)

Choose a numbered location for each label. Leave unused labels as “Not placed.”

The line angle diagram of an organic molecule.123456789
Show reference answer

This archived key gives example locations for repeated labels. It does not show a complete placement.

  • No H: location 9
  • 1 H: location 8
  • 1 H: location 9
  • 2 H: location 4
  • 3 H: location 7
  • 4 H: not placed

Question 1a, part iii

Drag and drop the appropiate labels to ONE target zone that includes a nonpolar functional group and to ONE target zone that includes a polar functional group that can participate in hydrogen bond formation.

Choose a numbered location for each label. Leave unused labels as “Not placed.”

The line angle diagram of an organic molecule.12345
Show answer
  • Polar: location 5
  • Nonpolar: location 4

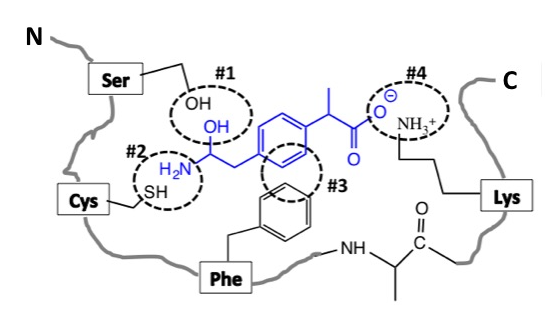
This schematic shows the interaction between Molecule 1 (shown in blue) and Enzyme X at dotted circles #1-#4.
For simplicity, only the side-chains of the amino acids of Enzyme X that interact with the Molecule 1 are shown.
Question 1b

Give the STRONGEST interaction at...

Show answer and explanation
  1. hydrophobic
  2. hydrogen
  3. ionic
  4. hydrogen

Explanation:

Hydrophobic interactions occur between groups that are nonpolar (C-C and C-H). Ionic interactions occur between groups that are charged (for attactive interactions, one group has a positive charge, the other has a negative charge). Hydrogen bonds occur between one group with an electronegative atom (N, O, or F) and one group that has a hydrogen bonded to an electronegative atom. To review this concept, revisit: 1.3 Types of Bonds.

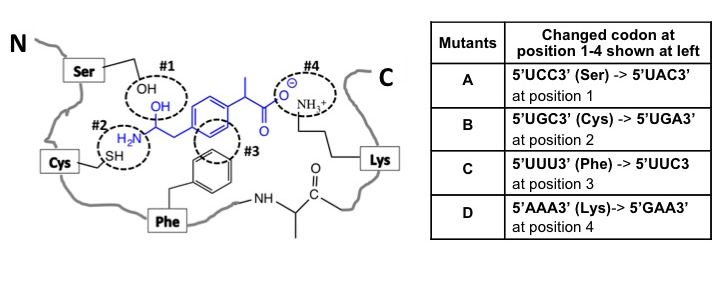
You identify four mutant versions (A-D) of the Enzyme X, each of which has mutation in one of the codons corresponding to amino acids shown above at positions 1–4. Please note that each interaction is critical for the Enzyme X - Molecule 1 binding.
Question 1c

Which TWO mutants are likely to bind to Molecule 1?

Show answer and explanation
  1. A, C

Explanation:

The mutants that are likely to bind to molecule 1 are those that are the most like the original protein. For example, if the original amino acid had a positive charge, then the mutant should also have a positive charge to (possibly) retain the original function. To solve this problem, translate each mutant codon to the amino acid, then compare the mutant to the original to determine if the amino acids are similar or different. Similar amino acids at the same position will likely result in binding to molecule 1. To review these concepts, revisit: 1.3 Types of Bonds and 3.4 Translation.

Question 2

Question 2 is worth a total of 8 points.

Question 2a

Enzyme X catalyzes the conversion of Molecule 1 (S) into a specific product (P) with a ΔG < 0.

Which energy profile represents an anabolic (energy requiring) reaction with a ΔG < 0? Select the best answer.

Two energy diagrams, with course of reaction on the x axis and G on the y axis. The left diagram starts at a low value, rises to a hill, then ends at a higher value. The right diagram starts at a high value, rises to a hill, then ends at a lower value. Both have blank boxes for later labeling.

On the right energy profile only (reproduced below), use the dropdown options to label the diagram.

One energy diagram, with course of reaction on the x axis and G on the y axis. The diagram starts at a higher value (labeled 1) and rises to a hill, then ends at a higher value (labeled 4). The difference between the top of the hill and the high value is labeled 3 and the difference between the high value and low value is labeled 2.

  • ΔG (free energy) is at location
  • EA (energy of activation) is at location
  • Molecule 1 (S) is at location
  • Specific product is at location

The published course does not expose an answer key for this question.

Question 2b

The mutant version of Enzyme X is less active than the wildtype. The ΔG of the reaction catalyzed by a mutant version of Enzyme X would be ____________ the ΔG of the normal/original Enzyme X catalyzed reaction.

Show answer and explanation
  1. equal to

Explanation:

The enzyme is catalyzing the same reaction, whether it is mutated or not, so the free energy of that reaction is also the same. However, the less active enzyme has a higher energy of activation to overcome to catalyze the reaction. To review this concept, revisit: 2.2 Free Energy and Reaction Kinetics.

Question 2c, part i

The following biochemical pathway shows how Molecule 1 is metabolized within a cell. The enzymes catalyzing different steps of the biochemical pathways are shown as E1-E4 and Enzyme X.

A multi-step pathway from Molecule 1 to products D and N. In order: Molecule 1 is made into P by enzyme X. P is made into C by E 1. C is made into D by E 2. In the other path: Molecule 1 is made into M by E 3. M is made into N by E 4. Product c inhibits E 3.

Which step represents the inhibitory feedback loop in the pathway? Select the best answer.

Show answer and explanation
  1. C inhibiting E3

Explanation:

Inhibitory steps are reprsented by "flat top" arrows, typically leading from a product created "late" in the pathway back toward an enzyme earlier in the pathway. To review this concept, revisit: 2.3 Pathways.

Question 2c, part ii

Show answer and explanation
  1. No

Explanation:

Enzymes X and E3 are both required for molecule 1 to be metabolized. To review this concept, revisit: 2.3 Pathways.

Question 2d

Gene X encodes Enzyme X that is a glycoprotein (protein that has a carbohydrate covalently added to it). Use the dropdown options to complete the table below.

Organelle Involved in Enzyme X synthesis? If yes, what process is involved?
Cytoskeleton
Nucleus
Endoplasmic Reticulum
Ribosomes
Golgi body
Show answer and explanation
  1. Yes
  2. Yes
  3. No
  4. translation
  5. Yes
  6. no involvement
  7. protein modification
  8. protein modification
  9. transcription
  10. Yes

Explanation:

To review this concept, revisit: 2.4 Organelles.

Question 3

Question 3 is worth a total of 12 points.

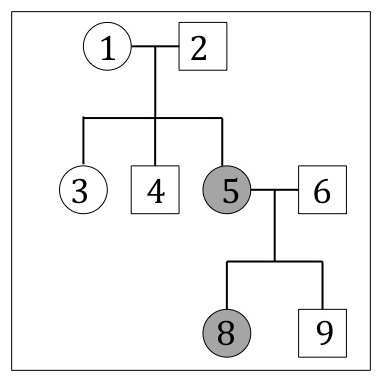
The following pedigree shows a disease that is caused by the ABSENCE of Enzyme X. Individual 6 has a genotype (Aa) and is unaffected.
NOTE: Filled circles represent affected females, open circles represent unaffected females, filled boxes represent affected males and open boxes represent unaffected males.

Question 3a, part i

The published course does not expose an answer key for this question.

Question 3a, part ii

Using “A” for the allele associated with the dominant phenotype and “a” for the allele associated with recessive phenotype, give ALL the possible genotypes of Individual #3.

Please separate each answer with a comma followed by a space, e.g. "M, N, L".

The published course does not expose an answer key for this question.

Question 3a, part iii

Individual #9 marries a female (Genotype: aa). What is the probability that their daughter will have the disease?

Please give your answer in terms of a percent rounded to the nearest whole number, e.g. "91" for 90.5%. Do not include a percent sign (%) in your answer.

Show answer and explanation
  1. 50

Explanation:

We must determine the genotypes of Individual #9 and their parents (Individuals #5 and #6). Since the sibling of individual #9 (Individual #8) is affected, we know that both parents (#5 and #6) must have at least one recessive allele. #5 is affected (genotype: aa) so #6 must be genotype: Aa. Since #9 themselves are unaffected, they must be genotype: Aa as well. If they marry someone with a genotype: aa, then the resulting offspring have a 50% chance of being Aa and 50% chance of being aa. Use a Punnett Square to solve this out! To review this concept, revisit: 4.4 Pedigrees.

You want to study body color (grey or cream) that is regulated by an autosomal gene, Gene D in fruit flies. Gene D can exist as “Allele D” (regulates the dominant phenotype) or “Allele d” (regulates the recessive phenotype). Cream is the recessive phenotype.

Question 3b, part i

You mate a homozygous grey fly (P1) with homozygous cream fly (P2) and get 1000 grey F1 flies. Give the genotype of the following flies in terms of D and d.


P1:


P2:


F1:

Show answer and explanation
  1. DD
  2. dd
  3. Dd

Explanation:

All the offspring (F1) are grey, so this must be the dominant trait. Therefore P1 is DD, P2 is dd, and F1 are all Dd. To review this concept, revisit: 4.3 Punnett Squares.

Introduction

You mate two F1 flies and get 1000 F2 flies. Complete the Punnett Square provided below and use it to answer the following questions.
NOTE: This is a tool to assist you. The Punnett Square itself will not be graded, only the questions below!

Complete the Punnett Square
Figure labeling the header and first column as the F 1 gametes. D
D

The published course does not expose an answer key for this question.

Question 3b, part ii

How many F2 flies would have the genotype ”Dd”? (Enter your answer as a whole number integer.)


How many F2 flies would have the cream body color? (Enter your answer as a whole number integer.)

Show answer and explanation
  1. 250
  2. 500

Explanation:

50% of the F2 flies have the Dd genotype: 1000 x 50% = 500. 25% of the F2 flies have the dd genotype corresponding to cream body color: 1000 x 25% = 250. To review this concept, revisit: 4.3 Punnett Squares.

Question 3c, parts i-ii

You identify a red eye fly (Fly #3) that is regulated by Gene R. (White is the recessive phenotype.) You perform a test cross to analyze if the genotype of Fly #3 is “Rr” or “RR”.

(i) Give the genotype of the fly with which you will mate Fly #3 for the test cross.


(ii) Give the ratios of the phenotypes and genotypes of the resulting flies if Fly #3 was heterozygous for Gene R.

Phenotype ratio:
Please give your answer in lowercase and without spaces in the following format: #red:#white


Genotype ratio:

  • RR out of 4
  • Rr out of 4
  • rr out of 4
Show answer and explanation
  1. rr
  2. 1red:1white or 1white:1red
  3. 0
  4. 2
  5. 2

Explanation:

Homozygous recessive parents are used in test crosses (in this question, a "rr" fly). To find the phenotype and genotype ratios, complete a Punnett Square where Parent 1 is Rr and Parent 2 is rr. To review this concept, revisit: 4.3 Punnett Squares.

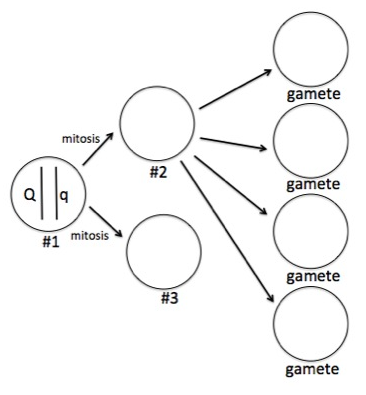
Please take a look at Cell #1 (Genotype: Qq) below that has a single pair of chromosome.
Question 3d, parts i-iii

(i) What is the ploidy of cell #1?

Choose from: haploid, diploid, triploid, tetraploid


(ii) If cell #1 divides by mitosis, what is the ploidy of...

cell #2?


cell #3?


(iii) Cell #2 divides to eventually form four gametes as shown. What type of division is this?

Show answer and explanation
  1. diploid
  2. diploid
  3. meiosis
  4. diploid

Explanation:

To review this concept, revisit: 2.5 Cell Division.

Question 3d, part iv

Considering the diagram and your answer to Question 3d, part iii, use the dropdown options to determine the chromosome content of the resulting gametes.

  • There are
    gamete(s) with a single "Q" chromosome.
  • There are
    gamete(s) with a single "q" chromosome.
  • There are
    gamete(s) with both a "Q" and "q" chromosome.
Show answer and explanation
  1. 0
  2. 2
  3. 2

Explanation:

This cell is dividing via meiosis, which gives daughter cells (gametes) that are haploid. To review this concept, revisit: 2.5 Cell Division.

Question 4

Question 4 is worth a total of 10 points.
There is a codon chart at the bottom of this page.

Question 4a

The following schematic represents a nucleotide base pair.

On the schematic, show ALL hydrogen bonds likely by placing a dashed line between the hydrogen bond donor and acceptor (the long drag and drop boxes). And show the dipoles as δ+ and δ- on ONE of the hydrogen bonds (the square drag and drop boxes).

Choose a numbered location for each label. Leave unused labels as “Not placed.”

A line angle diagram of two nucleic acid base pairs.123456
Show reference answer

This archived key gives example locations for repeated labels. It does not show a complete placement.

  • bond: location 3
  • δ+: location 6
  • δ-: location 5

Question 4b, part i

The following is the schematic of a nucleotide triphosphate with an unusual pentose sugar.

The line angle diagram of a nucleotide triphosphate with a pentose sugar. The triphosphate group is on the left, covalently bound to the sugar, which has no hydroxide (O H) groups. The base is covalently bound to the right side of the sugar.

Use the dropdown options to label each carbon atom of the sugar as 1 prime - 5 prime.

  • Carbon A:
  • Carbon B:
  • Carbon C:
  • Carbon D:
  • Carbon E:
Show answer and explanation
  1. 5 prime
  2. 1 prime
  3. 3 prime
  4. 4 prime
  5. 2 prime

Explanation:

To review this concept, revisit: 1.4 Recognizing Macromolecules and 1.5 Nucleic Acid Polarity.

Question 4b, part ii

The published course does not expose an answer key for this question.

The following is the sequence of a double stranded DNA.

Question 4c

Give the 5 base sequence that could serve as primer to synthesize most of the molecule shown if the bottom strand was used as template strand for transcription.
Please give you answer without spaces in the following format: X'NNNNNX'

The published course does not expose an answer key for this question.

Question 4d

You can also amplify the DNA in a test tube in vitro (in a test tube) using Polymerase chain reaction (PCR).

Select all the similarities between PCR and DNA replication.

Select all the differences between PCR and DNA replication.

Show answer and explanation
  1. Both require nucleotides to make new DNA., Both require template DNA., Both use DNA polymerase.
  2. One is regulated by cellular process and the other is regulated by temperature., One process amplifies DNA once and the other amplifies it many times., One process requires a DNA primer and the other requires a RNA primer.

Explanation:

If needed, try writing out the RNA strand with "/" in between each codon, then using the codon chart to translate into a peptide. To review this concept, revisit: 3.3 Transcription and 5.3 PCR.

Question 4e

If the Top strand in part c (displayed again above for your convenience) was used as a template for transcription…


(i) give the sequence of the newly transcribed RNA.
Please give your answer without spaces in the following format: X'NNNX'
The Xs should indicate polarity.

(ii) give the amino acid sequence of the newly translated peptide.
Please give your answer without spaces in the following format: X-Aaa-Aaa-X
The Xs should indicate polarity.

(iii) give the sequence of the 3 base anti-codon (on the tRNA) that corresponds to the 2nd codon.
Please give your answer without spaces in the following format: X'NNNX'
The Xs should indicate polarity.

(iv) give the amino acid sequence of the newly translated peptide if the bold and highlighted “T/A (Top/ Bottom)" base pair is changed to an “A/T (Top/ Bottom)" base pair.
Please give your answer without spaces in the following format: X-Aaa-Aaa-X
The Xs should indicate polarity.

The published course does not expose an answer key for this question.

Question 5

Question 5 is worth a total of 3 points.

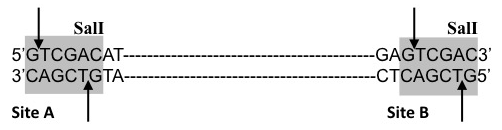
You want to clone part of Gene X that encodes Enzyme X. The following is the partial sequence of Gene X. It has recognition sites (shown in the grey boxes) for the restriction enzyme SalI, which cuts it at the positions shown by arrows.
Question 5a

Select the sequence of Gene X AFTER it has been cut with SalI at Site A and Site B.

The published course does not expose an answer key for this question.

Question 5b

Select the enzyme that would generate a base sequence which can ligate with SalI digested base sequence at Site A of Gene X.

Three different restriction enzyme sites are shown. The 6 base pair sequence is the same for all three enzymes with varying cut sites. For enzyme 1, the top strand reads 5' C T C G A cut G 3 prime and the bottom strand reads 3 prime G cut A G C T C 5 prime. For enzyme 2, the top strand reads 5' C T C cut G A G 3 prime and the bottom strand reads 3 prime G A G cut C T C 5 prime. For enzyme 3, the top strand reads 5' C cut T C G A G 3 prime and the bottom strand reads 3 prime G A G C T cut C 5 prime.

The published course does not expose an answer key for this question.

Question 5c

Ligation of the base sequences involves the formation of 3' to 5' phosphodiester bonds. This is an example of a...

The published course does not expose an answer key for this question.

References

MIT OpenCourseWare / MIT Open Learning Library. Hazel Sive and Diviya Ray. Adapted for local study under Creative Commons Attribution–NonCommercial–ShareAlike 4.0. License terms.