Problem Set 1

Your answers are saved in this browser. Check them against the downloaded answer key, or open the explanation when you are ready.

Question 1

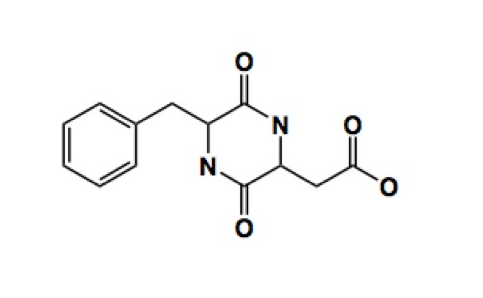
The following is the “line-angle” drawing of a molecule called diketopiperazine, an impurity found in the artificial sweetener aspartame. The carbon atoms and the hydrogen atoms bonded to them are not shown but implied.
Question 1a, part i

For the dashed boxes below, drag and drop carbon atoms ("C") onto the appropriate positions on the line angle drawing of diketopiperazine. (Note: you do not need to label every carbon, only those with drag and drop outlines.)

Choose a numbered location for each label. Leave unused labels as “Not placed.”

The line angle diagram of the molecule diketopiperazine.12345678910111213
Show reference answer

This archived key gives example locations for repeated labels. It does not show a complete placement.

  • C: location 11

Question 1a, part ii

Now, identify how many hydrogens are bound to each carbon of diketopiperazine. Drag and drop an icon with the correct number of H's over each of the carbon atoms on the figure. (Only place icons onto the carbons you identified in the problem above, Question 1a, part i. You may not need to use all the icons provided.)

Choose a numbered location for each label. Leave unused labels as “Not placed.”

The line angle diagram of the molecule diketopiperazine.12345678910111213
Show reference answer

This archived key gives example locations for repeated labels. It does not show a complete placement.

  • No H: location 11
  • 1 H: location 9
  • 2 H: location 10
  • 3 H: not placed
  • 4 H: not placed

Question 1a, part iii

Drag and drop the correct labels to ONE target zone that includes a nonpolar functional group and to ONE target zone that includes a polar functional group that can participate in hydrogen bond formation.

Choose a numbered location for each label. Leave unused labels as “Not placed.”

The line angle diagram of the molecule diketopiperazine.12345
Show answer
  • Polar: location 5
  • Nonpolar: location 2

Question 1a, part iv

What is the chemical formula of diketopiperazine? (Enter answers as whole number integers.)

How many C's?


How many H's?


How many N's?


How many O's?

The published course does not expose an answer key for this question.

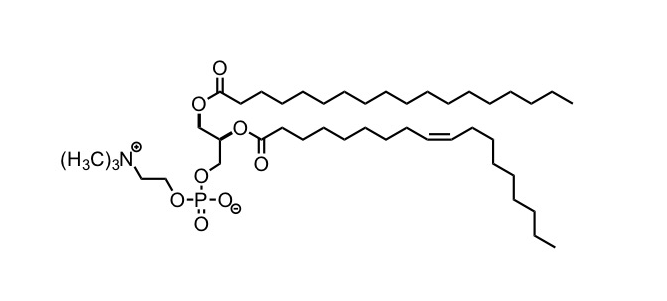
The following is a line angle drawing of a biological molecule. Multiple copies of this molecule can arrange and form the plasma membrane of a cell.
Question 1b, part i

The above molecule belongs to which class of macromolecules?
Select the correct response from the dropdown menu.

The published course does not expose an answer key for this question.

Question 1b, part ii

Which zone includes the part of the molecule that will be exposed to the aqueous (i.e. water filled) exterior or cytoplasm of the cell? Select the best answer.

The line angle diagram of a large molecule. To the left side of the molecule are multiple polar groups containing oxygen. To the right side of the molecule are two long carbon chains.

The published course does not expose an answer key for this question.

Question 1b, part iii

Which zone includes the part of the molecule that will form the hydrophobic region of the plasma membrane? Select the best answer.

The line angle diagram of a large molecule. To the left side of the molecule are multiple polar groups containing oxygen. To the right side of the molecule are two long carbon chains.

The published course does not expose an answer key for this question.

Question 1c

Drag and drop the symbols δ+ and δ- over the appropriate atoms to label a dipole in the molecule below.

Choose a numbered location for each label. Leave unused labels as “Not placed.”

The Lewis structure of a water molecule (H 2 O).123
Show reference answer

This archived key gives example locations for repeated labels. It does not show a complete placement.

  • δ+: location 2
  • δ-: location 3

Question 2

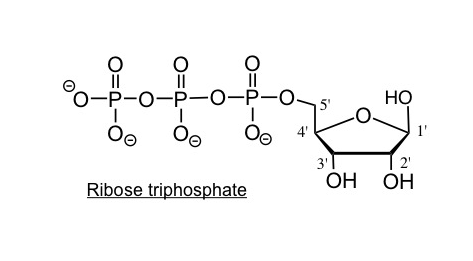
Question 2 parts a and b concern the following molecule.

Question 2a

Give the chemical formula of ribose (not ribose triphosphate).

Please give your answer without spaces in the following format: C#H#O#

The published course does not expose an answer key for this question.

Question 2b

Which covalent bond forms between ribose and triphosphate during a condensation reaction resulting in the formation of ribose triphosphate? Refer to the numbers above the corresponding bond. Select the best answer.

The line angle diagram of ribose triphosphate. Four bonds are labeled 1 through 4.

The published course does not expose an answer key for this question.

Question 2c

What is another product of the condensation reaction?

The published course does not expose an answer key for this question.

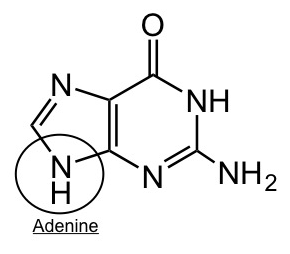
The following is adenine base, which can covalently bond, through condensation reaction with ribose sugar to form a nucleotide (ATP).
Question 2d

Which carbon atom of the ribose sugar would covalently bond with the circled region of adenine to form Adenosine triphoshphate (ATP)?

Would you classify this base as purine or pyrimidine?

The published course does not expose an answer key for this question.

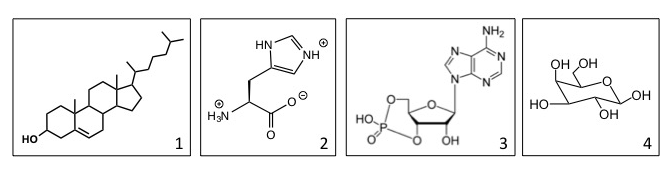
Four different structures are shown below.

Question 2e

Which molecule serves as a building block of proteins?

Which molecule is an example of steroids that may be found within the non-aqueous interior of the cell membrane?

Which structure is an example of a nucleotide?

The published course does not expose an answer key for this question.

Question 3

Question 3a

The formation of biological molecule usually requires energy (anabolic) with a ΔG>0.

Which energy profile represents an anabolic (energy requiring) reaction with a ΔG>0? Select the best answer.

Two energy diagrams, with course of reaction on the x axis and G on the y axis. The left diagram starts at a low value, rises to a hill, then ends at a higher value. The right diagram starts at a high value, rises to a hill, then ends at a lower value. Both have blank boxes for later labeling.

On the left energy profile only (reproduced below), use the dropdown options to label the diagram.

One energy diagram, with course of reaction on the x axis and G on the y axis. The left diagram starts at a low value (labeled 1) and rises to a hill, then ends at a higher value (labeled 3). The difference between the top of the hill and the low value is labeled 2 and the difference between the high value and low value is labeled 4.

  • ΔG (free energy) is at location
  • EA (energy of activation) is at location
  • Reactants are at location
  • Products are at location

The published course does not expose an answer key for this question.

Question 3b, part i

The schematic below shows a growing RNA polymer. Note: The nucleotide bases are shown in red.

1. Label the 5' and 3' ends in the shaded boxes.
2. Show the direction of polymerization of RNA by dragging the appropriate arrow to the target zone to the left of the molecule.
3. Drag and drop an X to the target zone above the nucleotide base that is uniquely a part of RNA and not part of DNA.

Choose a numbered location for each label. Leave unused labels as “Not placed.”

A line angle diagram of a nucleic acid polymer chain. From top to bottom, the bases are G A U G. Spaces are empty to denote the 3 prime and 5 prime ends.1234567
Show answer
  • 3' : location 2
  • 5': location 1
  • X: location 6
  • up arrow: not placed
  • down arrow: location 3

Question 3b, part ii

Give the DNA sequence that is complementary to the RNA sequence above.
Please give your answer without spaces in the following format: X'NNNX'

The published course does not expose an answer key for this question.

Question 4

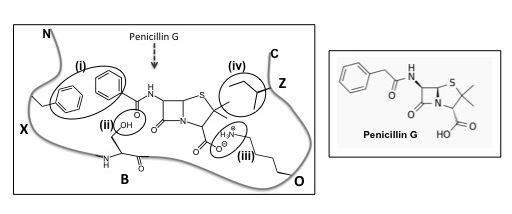
This schematic shows the binding of Penicillin G to a protein. For simplicity, only the side-chains of amino acids (X, B, O, Z) that interact with Penicillin G are shown. The structure of Penicillin G alone is also shown.
Question 4a

Identify the non-covalent interactions between penicillin G with the protein at...

region (i)

region (ii)

region (iii)

region (iv)

The published course does not expose an answer key for this question.

Question 4b, part i

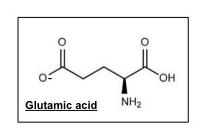
Would Penicillin G be able to bind to the mutant version of this protein that has a single amino acid substitution i.e. amino acid “O” is substituted by glutamic acid diagrammed above?

The published course does not expose an answer key for this question.

Question 4c, part i

The following pathway shows the conversion of amino acid Threonine to Glycine or Isoleucine.

Which step (activation or inhibition arrow) constitutes a negative feedback loop? Select the best answer.

The pathway for conversion of threonine to glycine or isoleucine. Each step in the pathway is labeled 1 through 4. Step 1 is threonine to 2 oxobutyrate by enzyme threonine deaminase. Step 2 is 2 oxobutyrate to isoleucine by enzyme A. Step 3 is inhibition of threonine deaminase by isoleucine. Step 4 is threonine to glycine by threonine aldolase.

The published course does not expose an answer key for this question.

Question 4c, part ii

How would an increase in the concentration of Isoleucine affect the amount of Glycine produced?

The published course does not expose an answer key for this question.

Question 5

Question 5a

The following is the schematic of a diploid somatic cell (Genotype: Bb) that is undergoing MITOSIS. Note: The paternal homolog for chromosome 1, in the somatic cell, is shown as a solid black line whereas the maternal homolog for the same chromosome is shown as a solid gray line. Also shown are the alleles of Gene B on paternal and maternal homologs.

A flow chart of a cell undergoing mitosis. The parent cell has one B chromosome and one small b chromosome. Then the cell undergoes DNA replication and splits into daughter cells. Both steps have been left blank for the following questions.

Select the icon(s) that represent the replicated chromosomes in the parental cell.

Select the icon(s) that represent the daughter cells.

The published course does not expose an answer key for this question.

Question 5b

The following is the schematic of a diploid cell (Genotype: Bb) that is undergoing MEIOTIC cell division. Note: The paternal homolog for chromosome 1, in the somatic cell, is shown as a solid black line whereas the maternal homolog for the same chromosome is shown as a solid gray line. Also shown are the alleles of Gene B on paternal and maternal homologs.

A flow chart of a cell undergoing meiosis. The parent cell has one B chromosome and one small b chromosome. Then the cell undergoes DNA replication, splits into 2 daughter cells in meiosis I, then those daughts each split into 2 daughters in meiosis II. All three steps have been left blank for the following questions.

Select the icon(s) that represent the replicated chromosomes in meiosis I.

Select the icon(s) that represent the daughter cells of meiosis I.

Select the icon(s) that represent the daughter cells of meiosis II.

The published course does not expose an answer key for this question.

Question 6

Question 6

Complete the table by selecting the dropdown keywords for a eukaryotic somatic cell.

Description Location or organelle in a somatic cell
Stacked membrane-bound structures involved in the modification and transport of proteins after their synthesis
The location of the genome or hereditary information that is passed on by a cell to its daughter cells during cell division
Location of the proteins that maintain the shape and motility of a cell
Membranous structures that are involved in protein synthesis and are studded with ribosomes

The published course does not expose an answer key for this question.

MIT OpenCourseWare / MIT Open Learning Library. Hazel Sive and Diviya Ray. Adapted for local study under Creative Commons Attribution–NonCommercial–ShareAlike 4.0. License terms.