Chapter 33A Topology-Constrained Network Algorithm for NOESY Data Interpretation
We now move from distance geometry to the related, practical problem of NOE assignment, which is also informed by graph topology. In this chapter, we discuss a nuclear Overhauser effect (NOE) assignment approach applied in the software AutoStructure [1], which formulates the problem into a topology-constrained distance network, and then iteratively refines the distance network that interprets the NOESY data and restrains the structure calculations.
Algorithms
The flow chart of AutoStructure’s NOESY data interpretation approach for structure calculation in [1] is shown in figure 33.1. The procedure is divided into two parts: initial fold analysis and iterative structure analysis. The initial fold analysis stage obtains an optimal distance network and calculates the initial global fold. The iterative structure analysis stage iteratively refines the NOE-constrained distance network and intermediate structures.
Table 33.1 lists the graph theory formulation used in the algorithm, which is illustrated in figure 33.2.
Step 1: Preparation of Input Data The input data for AutoStructure includes the (1) protein amino acid sequence, (2) resonance assignments, (3) NOESY peak list from third-party peak-picking software, (4) scalar coupling data (optional), (5) amide exchange data (optional), and (6) other constraint data, such as RDCs.
Step 2: Construction of Initial Ambiguous Network The initial ambiguous NOE distance network is formed by matching frequencies of NOESY cross peaks with chemical shifts in the resonance assignment list within error match tolerances (table 33.1).
Step 3: Input Data Validation and Heuristic Distance Network Initialization To validate the input NOESY data, AutoStructure first constructs a local distance network , which basically contains the geometric proximity information based on bond-connections solely indicated from protein sequence and resonance list. Then , a measurement of input data quality, is defined as

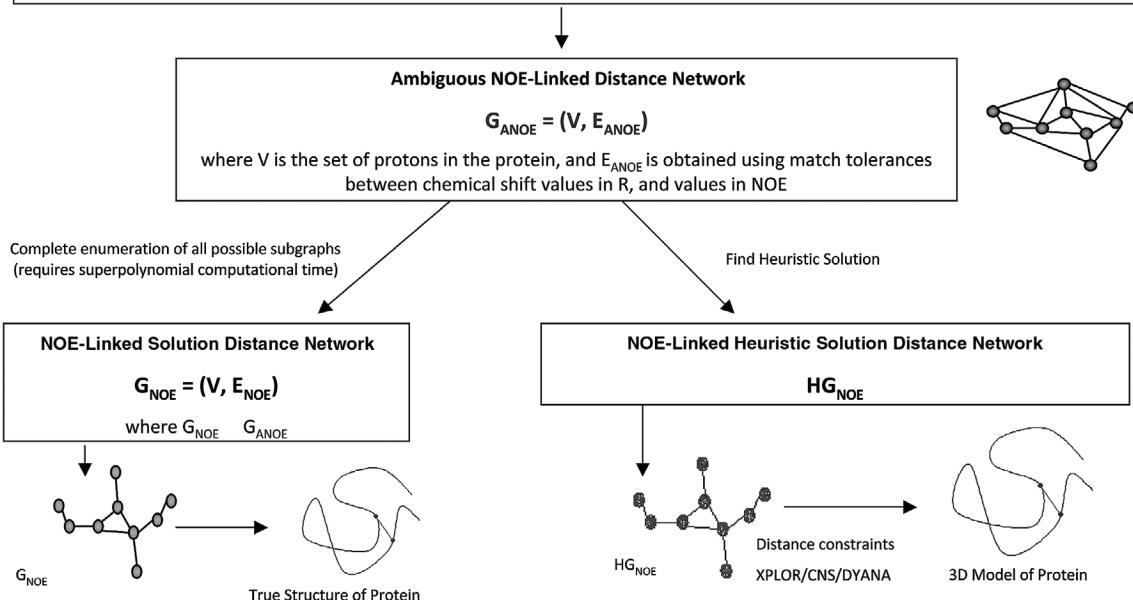
Figure 33.1 AutoStructure’s formulation of the NOESY interpretation problem using graph theory. Figure by Janet Huang and Guy Montelione.
Table 33.1 Summary of key parameters [1]
| Symbol | Definition | Default Value |
|---|---|---|
| The maximum distance observed in NOESY spectrum | 5.0 Å | |
| Error match tolerances for the i th dimension | H: 0.05
ppm : 0.5 ppm |
|
| Allowable match tolerances for the i th dimension | H: 0.04
ppm : 0.4 ppm |
|
| Good match tolerances for the i th dimension | H: 0.03
ppm : 0.3 ppm |
|
| Threshold for symmetric peaks | H: 0.03
ppm : 0.3 ppm |
|
| Threshold of the minimum distance violation | 0.1 Å | |
| Threshold of the minimum model-support score | 0.4 | |
| Threshold of the high model-support score | 0.7 |
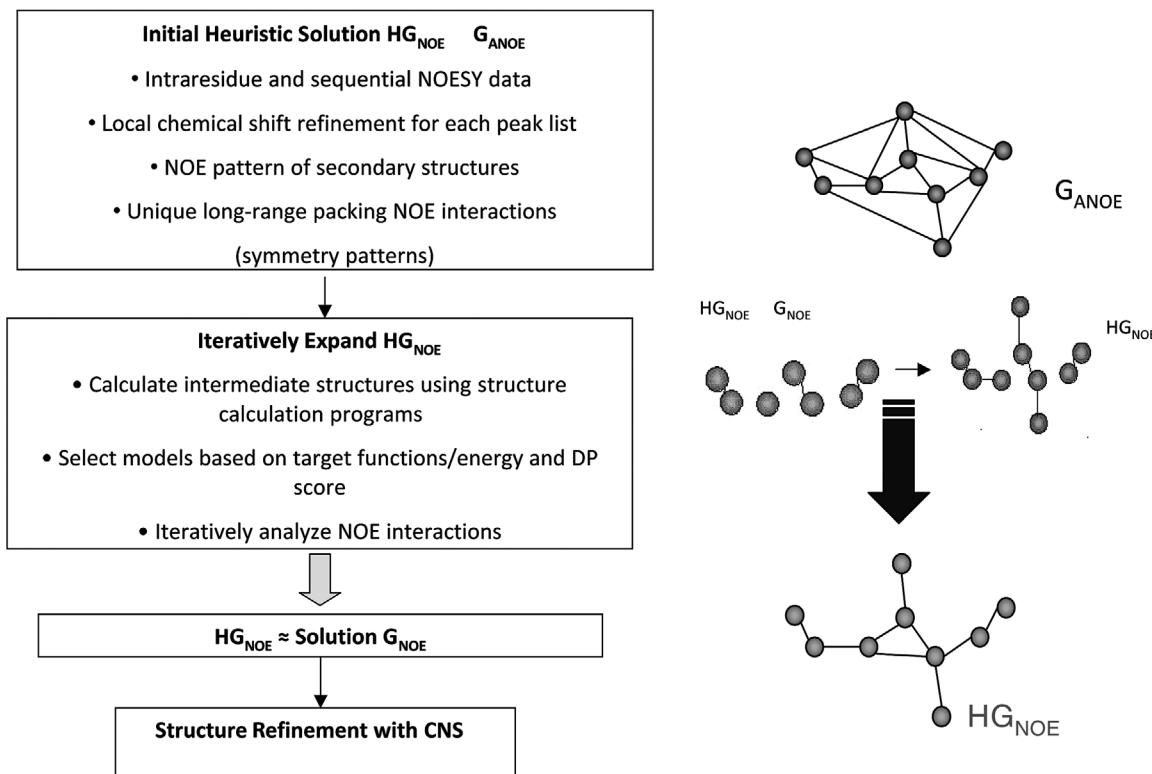
Figure 33.2Autostructure is a topology-constrained bottom-up approach for finding the heuristic solution, . Figure by Janet Huang and Guy Montelione.
If is larger than certain threshold, AutoStructure will require users to refine the input data. The heuristic distance network is obtained from by using narrower error tolerances and adding obvious pairs of NOE interactions, such as , and .
Step 4: Refine Resonance Assignment List Based on and Prune In this step, resonances are refined based on the mean value of all linked NOE cross peaks. Then the refined resonance list is used to improve the NOE distance network.
Step 5: Generation of Initial This step is divided into two parts. In the first part, the NOE patterns of secondary structure elements are added into the distance network . The secondary structures are identified based on the following information: characteristic NOE patterns, chemical shift index, and scalar coupling data. In the second part, the NOE distance network is refined by symmetry checking and identification of unique connections. Potential contact support scores, which measure the confidence of an assigned proton pair, are used to filter out weakly supported but “apparently unique” proton pairs.
Step 6: Construct Initial Structure and Refine Self-Consistent The following constraint information is fed into other software such as XPLOR/CNS or DYANA to calculate the initial structure: distance constraints calibrated from peak intensity, dihedral angle constraints (obtained by using a conformational grid search approach from local NOEs and scalar coupling data), H-bond distance constraints (obtained from helix and beta-sheet NOE contact patterns and slow amide hydrogen exchange data). Then the heuristic distance network is refined based on the initial structure.
Step 7: Iterative Fold Analysis and Refinement of Using Intermediate Structures First, the NOE constraints are refined to be consistent with the topology constraints from helical-packing and beta-sheet packing geometries. Then a model-support (ms) score for each peak is computed based on the appearing frequency of short distances in graphs, which are computed from all intermediate structures. Only those NOE assignments with high ms scores are considered to be well-supported from the intermediate structures and added into the heuristic NOE distance network. In less well-defined or loosely packed regions, loose criteria such as a larger upper-bound for distance limit and loose symmetric checking are used (cf. section 18.1.3). At the same
Table 33.2 Summary of experimental NMR data sets used for validation of AutoStructure [1]
| Protein | FGF-2 | MMP-1 | IL-13 |
|---|---|---|---|
| Fold class | |||
| Size (residues) | 154 | 169 | 113 |
| Assigned chemical shifts (set R) | |||
| All (% completeness) | 94.7 | 90.5 | 93.7 |
| Side-chain atoms (% completeness) | 91.5 | 85.4 | 90.3 |
| Aromatic atoms (% completeness) | 93.8 | 83.6 | 92.7 |
| Completeness of stereospecific isopropyl methyl proton assignments | 16/84 (19.1%) | 6/80 (7.5%) | 56/88 (63.6%) |
| Completeness of stereospecific methylene proton assignments | 156/444 (35.1%) | 86/408 (21.1%) | 80/284 (28.2%) |
| NOESY spectra (set NOE) | |||
| Peaks picked from 3D() spectrum | 1353 | 2409 | 1994 |
| Assignable | 1255 | 2003 | 1509 |
| Peaks picked from 3D() spectrum | 3702 | 3043 | 4143 |
| Assignable | 3588 | 2970 | 3943 |
| Input validation—M score | |||
| 3D() spectrum (%) | 12 | 4 | 7 |
| 3D() spectrum (%) | 15 | 24 | 6 |
| Overall (%) | 14 | 21 | 6 |
time, suspect long-range orphan contacts, that is long-range contacts whose neighboring residues have no long-range contacts, are removed from .
Step 8: Assessment of Final Structure The following measurements are used to assess final structures: recall score, precision score, F-measure score, and discriminating power (DP) score. Recall score is the fraction of NOE cross peaks consistent with the resulting structures. Precision score is the fraction of back-calculated interproton interactions that are observed in peak list. F-measure score is the overall fit between the resulting structures and experimental data. Discriminating power (DP) score, which calculates the difference in F-measure scores between the
Figure 33.3 (plate 35)
Calculated structures in intermediate and final ensembles. Figure by Janet Huang and Guy Montelione.
query structure and “random coil” structures (a freely rotating chain model), is used to estimate the correctness of the overall fold.
The approach in step 8 has been extended into a protocol called RPF score (Recall, Precision, and F-measure) for NMR structure validation [2]. An improved version of AutoStructure (AS), called ASDP, uses RPF to define a DP score for intermediates in the AS trajectory, which permits selecting more accurate intermediate models to resolve ambiguous assignments. This results in more accurate interpretation of the NOESY data, and better convergence.
As described in step 8, RPF scores [2] assess how well the query 3D structures fit the experimental NOESY peak list and resonance assignment data. RPF scores compute the goodness-of-fit of the query structures to these experimental data, and can be used as a guide for further structure refinements. RPF also calculates DP scores (step 8). DP score has been used by CS-Rosetta for model selection (see chapter 45 and [3]).
The second-generation version of AutoStructure, ASDP, uses DP scores from RPF to select models generated in AutoStructure’s iterative cycles. Only the top models with highest DP scores and lowest target function (CYANA) or conformational energy (XPLOR) values are selected for iterative AutoStructure NOE analysis. Using a DP filter for model selection improves the accuracy
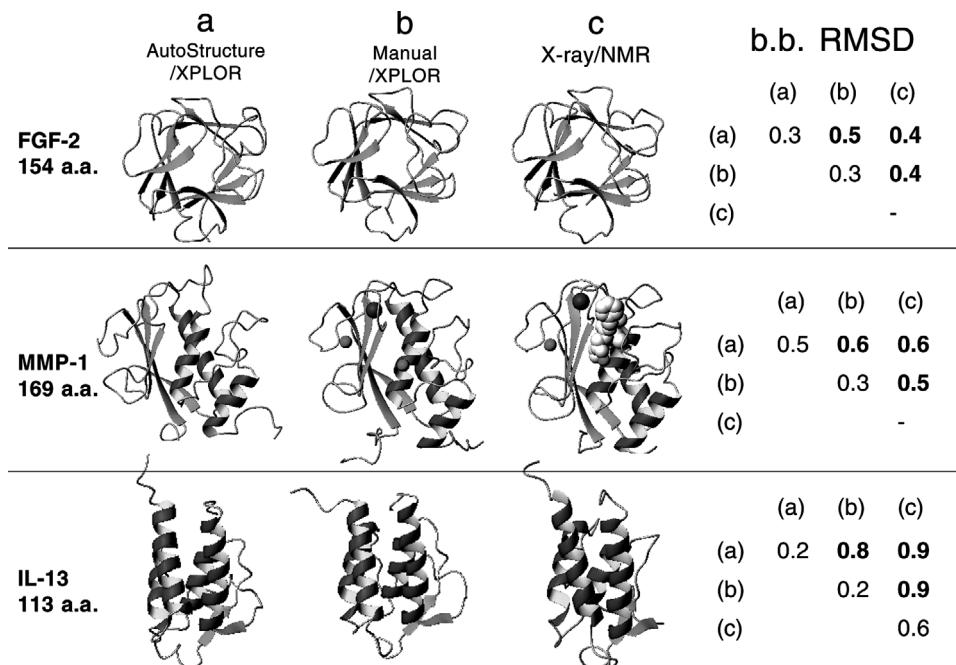
Figure 33.4 (plate 36)
Structures calculated by AutoStructure vs. other methods. The (b) method combines manual assignment analysis with optimization techniques such as SA/MD. Figure by Janet Huang and Guy Montelione.
of the selected intermediate structures for iterative NOE analysis and therefore improves the accuracy of NOESY crosspeak assignments and final models.
Results
AutoStructure has been evaluated using three different human protein NMR test data sets: FGF-2, IL-13, and MMP-1, ranging in size from 113 to 169 amino acid residues. The experimental NMR data used in the tests are given in table 33.2. Figure 33.3 (plate 35) illustrates the structures
Table 33.3 Comparisons of computed structures with other methods [1]
| Quality | FGF-2 | MMP-1 | IL13 |
|---|---|---|---|
| A. AutoStructure models | |||
| NOE crosspeaks assigned | |||
| 15 N-NOESY | 1147 | 1613 | 1214 |
| 13 C-NOESY | 3160 | 2522 | 3254 |
| Constraints | |||
| NOE distance constraints | 2058 | 2088 | 2705 |
| Hydrogen bond distance constraints | 76 | 86 | 76 |
| Dihedral angle constraints | 177 | 221 | 165 |
| RPF scores | 94.2/92.1/93.2/85.4 | 88.6/89.2/88.9/79.5 | 87.3/96.9/91.9/79.8 |
| RMSD | |||
| Sec. Strut. Region (b.b./heavy) | 0.3/0.9 | 0.5/1.0 | 0.2/0.7 |
| Ordered region (b.b./heavy) | 0.7/1.3 | 1.3/1.8 | 0.6/1.1 |
| Ramachandran plot summary from | 75.0/23.9/1.1/0.0 | 81.7/18.0/0.3/0.0 | 90.4/9.3/0.1/0.1 |
| PROCHECK | |||
| B. Manual analysis models | |||
| Constraints | |||
| NOE distance constraints | 2105 | 2078 | 1979 |
| Hydrogen bond distance constraints | 50 | 84 | 50 |
| Dihedral angle constraints | 330 | 426 | 302 |
| RPF scores | 94.5/92.6/93.5/86.2 | 88.9/89.6/89.2/80.7 | 82.5/97.1/89.2/72.3 |
| RMSD | |||
| Sec. Strut. region (b.b./heavy) | 0.3/0.7 | 0.3/0.6 | 0.2/0.7 |
| Ordered region (b.b./heavy) | 0.4/0.8 | 0.4/0.8 | 0.4/0.8 |
| Ramachandran plot summary from | 77.5/21.5/1.0/0.0 | 90.1/9.8/0.31/0.0 | 91.1/8.0/0.9/0.0 |
| PROCHECK | |||
| C. Comparisons between AutoStructure and manual analysis | |||
| % Distance constraints of | 3.3 | 3.7 | 5.8 |
| AutoStructure that are violated by >1.0 Å in manual analysis models | |||
| % Distance constraints of manual analysis that are violated by >1.0 Å in AutoStructure analysis models | 4.2 | 5.1 | 3.9 |
| Mean Coordinate Differences | |||
| Sec. Strut. Region (b.b./heavy) | 0.5/0.6 | 0.6/0.8 | 0.8/0.9 |
| Ordered region (b.b./heavy) | 0.8/1.0 | 1.2/1.5 | 1.4/1.6 |
calculated in intermediate and final ensembles. Figure 33.4 (plate 36) and table 33.3 compare structures computed by AutoStructure vs. those from other approaches. The AutoStructure program has been used by several NMR groups, and more than two dozen protein structures have been determined using AutoStructure. ASDP was assessed in the first CASD-NMR workshop [4], where it performed well.
References
- [1] Y. J. Huang, R. Tejero, R. Powers, and G. T. Montelione. A topology-constrained distance network algorithm for protein structure determination from NOESY data. Proteins 62;3 (2006 Mar 15):587–603.
- [2] Y. J. Huang, R. Powers, and G. T. Montelione. Protein NMR recall, precision, and F-measure scores (RPF scores): Structure quality assessment measures based on information retrieval statistics. Journal of the American Chemical Society 127, 1665–74 (2005).
- [3] Raman, S. Huang, Y.J., Mao, B., Rossi, P., Aramini, J.M., Liu, G., Montelione G.T., and Baker, D. Accurate Automated Protein NMR Structure Determination Using Unassigned NOESY Data. Journal of the American Chemical Society 132, 202–207 (2010).
- [4] A. Rosato, A. Bagaria, D. Baker, B. Bardiaux, A. Cavalli, J. F. Doreleijers, et al. CASD-NMR: A rolling experiment for the critical assessment of automated structure determination of proteins from NMR data. Nature Methods 6(2009): 625–626.