Chapter 35Errors in Structure Determination by NMR Spectroscopy
This chapter describes the different types and sources of errors in the determination of structures by NMR. We address concerns in terms of experimental data collection as well as touch on algorithmic problems, highlighting the possibility of errors in the deposited structures to the Protein Data Bank (PDB) [1, 2, 3]. Improved algorithms, and the use of RDC data, have the potential to compute structures without such errors.
Errors in Published Protein Folds
There are many examples of proteins for which incorrect structures were published, and some of these have been revised or replaced by a new structure in the PDB. One example, as shown in figure 35.1 (plate 37), is phosphoactive yellow protein (PDB id: 2PHY, replacing 1PHY), which was determined by X-ray crystallography. Phosphoactive yellow protein was incorrectly solved due to problems in electron density interpretation, and subsequently a major change in the fold was determined [2].
Currently, X-ray crystallography and nuclear magnetic resonance (NMR) spectroscopy are two main techniques for high-resolution biomolecular structure determination, and all resulting models from these experiments are derived from their underlying experimental data. In this process, different problems may lead to errors. Purifying the wrong protein, very noisy data (and thus, for example, misassigning spectral signals in NMR), and problems in the structure-determination algorithm and error-checking themselves are all possible sources of errors [1, 2], and the results can be as disastrous as an incorrect fold.
Case Study: Dynein Light Chain
Certain problems arose in building a homology model for the protein dynein light chain (DLC2A). Using a BLAST search, one finds two NMR homologous structures, 1Y4O from mouse and 1TGQ from human, in the PDB with more than 95% sequence identity. Surprisingly, a first visual inspection of both structures reveals striking differences. As illustrated in figure 35.2 (plate 38), compared to the human version of DLC2A as a monomer, the mouse version appeared in the PDB as a dimer. Given the fact that two sequences sharing over 30% sequence identity in 100 aligned residues are very likely to have the same fold [3], it is extremely unlikely that both mouse and human DLC2A structures are correct.
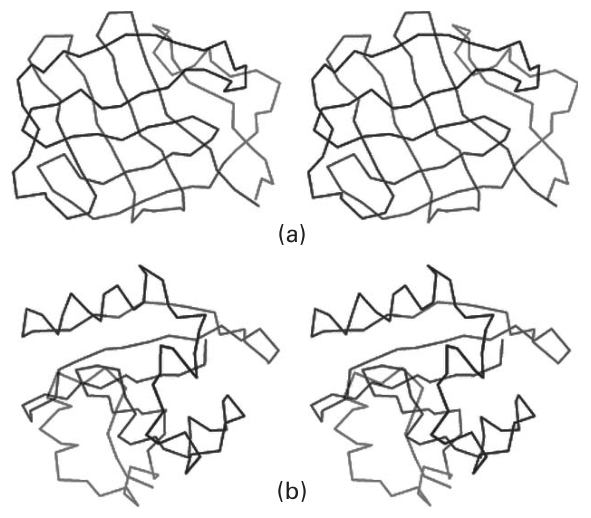
Figure 35.1 (plate 37) Comparison of an incorrect protein model with its corrected counterparts. The model is stereo Cα traces color-ramped from blue at the N-terminus to red at the C-terminus. (a) Incorrect model of photoactive yellow protein (PDB ID: 1phy) and (b) the corrected model (2phy). In this case, the initial model displayed a -clam fold, whereas the correct model revealed an protein with a fold similar to that of the SH2 domain [2]. Copyright 2000 IUCr.
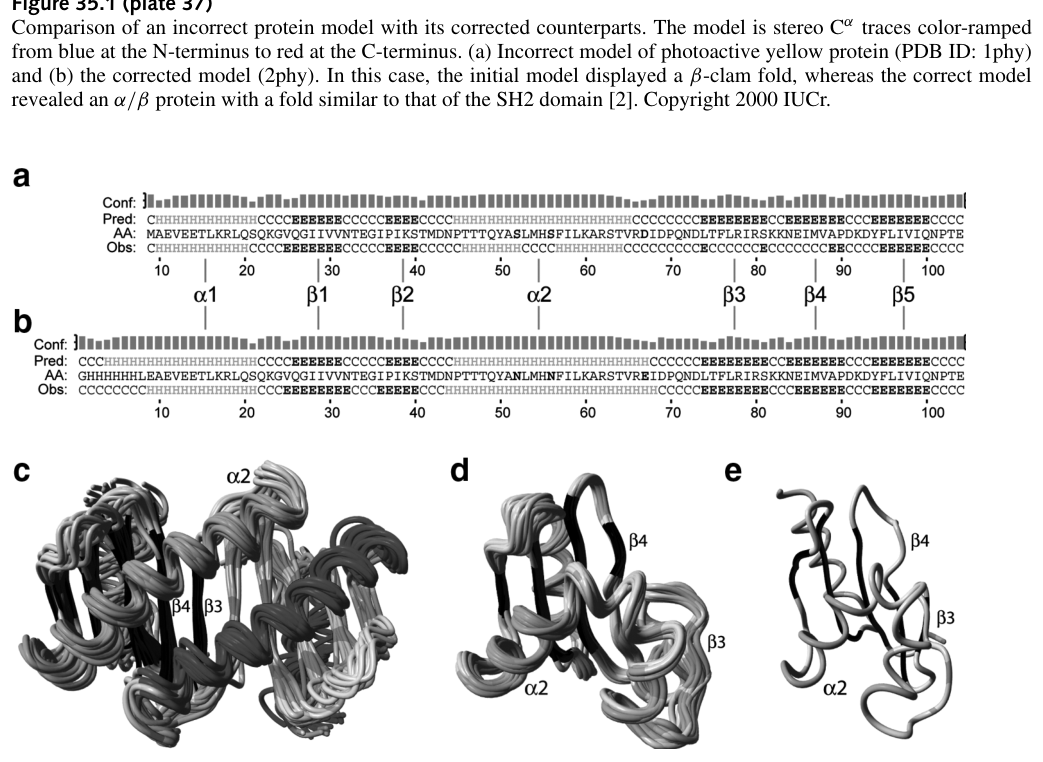
Figure 35.2 (plate 38) Sequence and structure ensembles of two DLC2A structures. (a and b) The sequences of human (hDLC2A) and mouse (mDLC2A); (c) Ribbon diagram of the structure ensemble of mDLC2A (PDB ID: 1Y4O); (d) ribbon diagram of the structure ensemble of hDLC2A (PDB ID: 1TGQ); (e) the refined average structure of the ensemble calculated using the reconstructed 1TGQ dataset [1].
This large difference between the two ensembles probably originates from the oligomeric state of the two structures (see sections 17.5 and 18.1.4). The structures of these two proteins were derived from NMR spectroscopy; in particular, the presence of the tertiary structures were assessed using a proton-nitrogen correlation () spectrum. It is not straightforward to determine the oligomeric state of a protein from its NMR spectra alone, and typically assessments must be made from estimates of the protein’s relaxation rates. Therefore, if the oligomeric state of a protein is not known or is incorrectly known, the NMR spectra of a dimeric protein could easily be interpreted as originating from a monomer. In this case, the assignment of human DLC2A (PDB ID: 1TGQ) was based on the assumption of monomeric structure, and thus it is incorrectly interpreted the intermolecular contacts as intramolecular contacts. To further test this hypothesis, if we switch the 72 original intermolecular NOEs of the mouse DLC2A to be 36 intramolecular restraints (since those for the 1TGQ ensemble were not available), the subsequently computed structure has a similar fold to the monomer originally derived for the human ortholog [1]. In addition, it has been shown experimentally that dynein light chain exists as the dimer.
Identifying the Problems: Problems in Identifiers
Table 35.1 lists various typical “checks” used in determining the appropriateness of a structure [1]. The 1TGQ structure (monomer, human DLC2A) was subjected to a series of refinements to improve the structure, while keeping it in its monomer form. These conditions include setting rules for dihedral restraints, as well as looking at the rotamer normality and backbone conformation.1 Observe that the only clear correlation between the incorrect structure and the various criteria is the rotamer normality; however, the backbone conformation does not change at all between the unrefined and refined 1TGQ structures.
Moreover, figure 35.3 (plate 39) plots the structure quality -scores for a large set of NMR structures deposited after 2003. As can be seen, 1TGQ is scored low on a distribution of these NMR ensembles [1]. As another example, figure 35.4 (plate 40) shows the PDZ domain of PTP-Bas (hydrolase), where panel (a) indicates an arginine side-chain in hydrophobic core, and panel (b) shows a homologous domain to the PTP-Bas, with a strangely solvent-exposed arginine side-chain. In this case, RDC data could likely be used to distinguish between these backbones, one of which may be incorrect.
1 The ROTCHK command will compare the rotamer of all residues with the distribution of observed rotamers for the same residue type in a similar local backbone conformation in the database. Also, the backbone conformation check will check whether there are fragments of coordinates that are not represented by other structures in the WHAT IF database.
Table 35.1 Average quality indicators of the 1Y4O and 1TGQ structure ensembles before and after refinement in an explicit solvent model [1]
| Criteria | Characteristic | 1Y4O (Original) |
1Y4O (Refined) |
1TGQ (Original) |
1TGQ (Refined) |
|---|---|---|---|---|---|
| Agreement with experimental data |
RMS violation 1Y4O distance restraints (Å) | 0.0129 | 0.0097 | 0.607 | 0.0284 |
| Violations > 0.5 Å 1Y4O distance restraints | 0 | 0 | 63 | 0 | |
| RMS violation 1TGQ sim restraints (Å) | 12.8 | 12.6 | 0.521 | 0.0231 | |
| Violations > 0.5 Å 1TGQ sim restraints | 32 | 32 | 4 | 0 | |
| RMS violation 1Y4O dihedral restraints (e) | 0.497 | 0.336 | 25.0 | 1.59 | |
| Violations > 5° 1Y4O dihedral restraints | 0 | 0 | 34 | 4 | |
| PROCHECK validation results a |
Most favored regions | 91.2 | 90.5 | 67.7 | 85.8 |
| Additionally allowed regions | 8.4 | 9.0 | 27.3 | 12.8 | |
| Generously allowed regions | 0.2 | 0.2 | 4.7 | 0.5 | |
| Disallowed regions | 0.2 | 0.3 | 0.2 | 0.9 | |
| Packing quality | -0.4 | 0.1 | -2.1 | -1.5 | |
| Ramachandran plot appearance | -3.6 | -3.3 | -6.6 | -4.6 | |
| WHAT IF structure Z-scores b |
Xi / X 2 rotamer normality | -0.3 | -0.7 | -5.8 | -3.0 |
| Backbone conformation | -0.8 | -1.1 | -5.4 | -5.4 |
aPercentage of residues present in the four different regions of the Ramachandran plot.bA Z-score [31,32] is defined as the deviation from the average value for this indicator observed in a database of high-resolution crystal structures, expressed in units of the standard deviation of this database-derived average. Typically, Z-scores below a value of -3 are considered poor, those below -4 are considered bad. DOI: 10.1371/journal.pcbi.0020009.t001
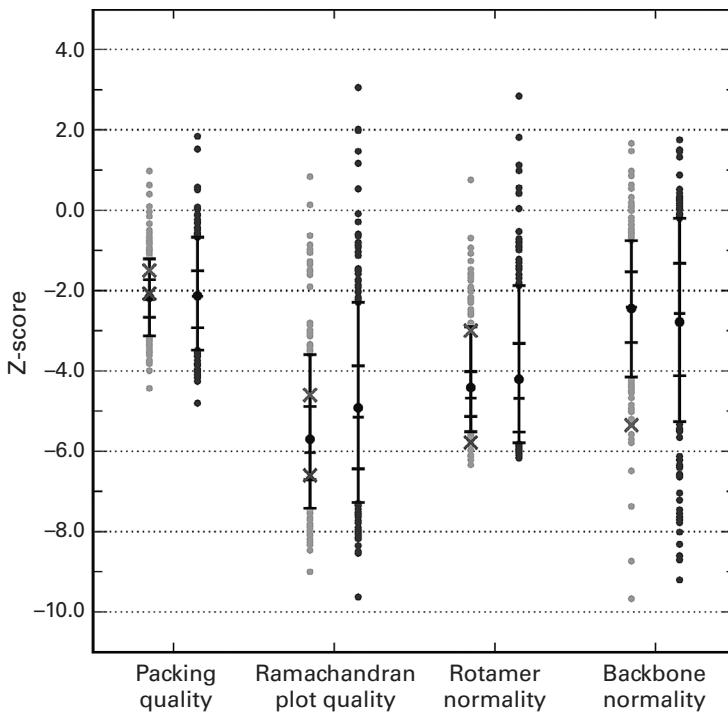
Figure 35.3 (plate 39) Structure quality Z-scores for a large set of the NMR structures after 2003 [1].
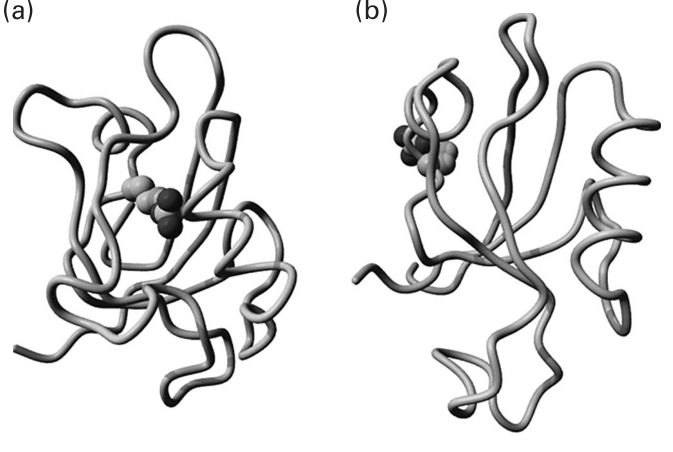
Figure 35.4 (plate 40) An example of observed structural anomalies [1].
References
- [1] S. B. Nabuurs, C. A. Spronk, G. W. Vuister, and G. Vriend. Traditional biomolecular structure determination by NMR spectroscopy allows for major errors. PLoS Computational Biology 2;2 (2006 Feb):e9.
- [2] G. J. Kleywegt. Validation of protein crystal structures. Acta Crystallographica D Biological Crystallography 56;3 (2000 Mar): 249–265.
- [3] B. Rost. Twilight zone of protein sequence alignments. Protein Engineering 12;2 (1999 Feb): 85–94.