Chapter 43NMR Resonance Assignment Assisted by Mass Spectrometry
This chapter discusses a novel algorithm for NMR resonance assignment, which is assisted by mass spectrometry [1, 2]. It is quite interesting to combine these two biophysical techniques in one algorithm.
Motivation
Nuclear magnetic resonance (NMR) is a useful tool for determining the structure of biomolecules, especially for those molecules that are difficult to crystallize for diffraction studies. A key step in structure determination by NMR is the resonance assignment of chemical shifts. The traditional NMR resonance assignment protocol uses triple resonance experiments, such as HNCA, to help identify the connectivities between amino acids. However, for some mammalian proteins that are difficult to express in doubly labeled forms, we may need novel structure determination strategies that depend on only the basic – HSQC experiment, which requires only isotopic labeling. Prestegard and co-workers [1, 2] propose a new approach using integration of NMR and mass spectrometry (MS) for protein resonance assignment.
Mass Spectrometry–Assisted NMR Assignment
Principle of the Approach
The MS-assisted NMR assignment approach exploits the fact that both NMR and MS can monitor rates of exchange of amide protons (HX rate) with water deuterons. Based on this observation, we can connect crosspeaks in NMR data and fragment masses in MS data by correlating the HX rates to help the sequential assignment.
Extracting HX Rates by HSQC
The process of extracting HX rates by HSQC is shown in figure 43.1a. We can extract the amide exchange rates by monitoring the loss of individual peak intensities as a function of time after dissolving a protein in deuterated water. We fit the intensity data to the equation , where is the residue-specific HX rate and is the intensity of an
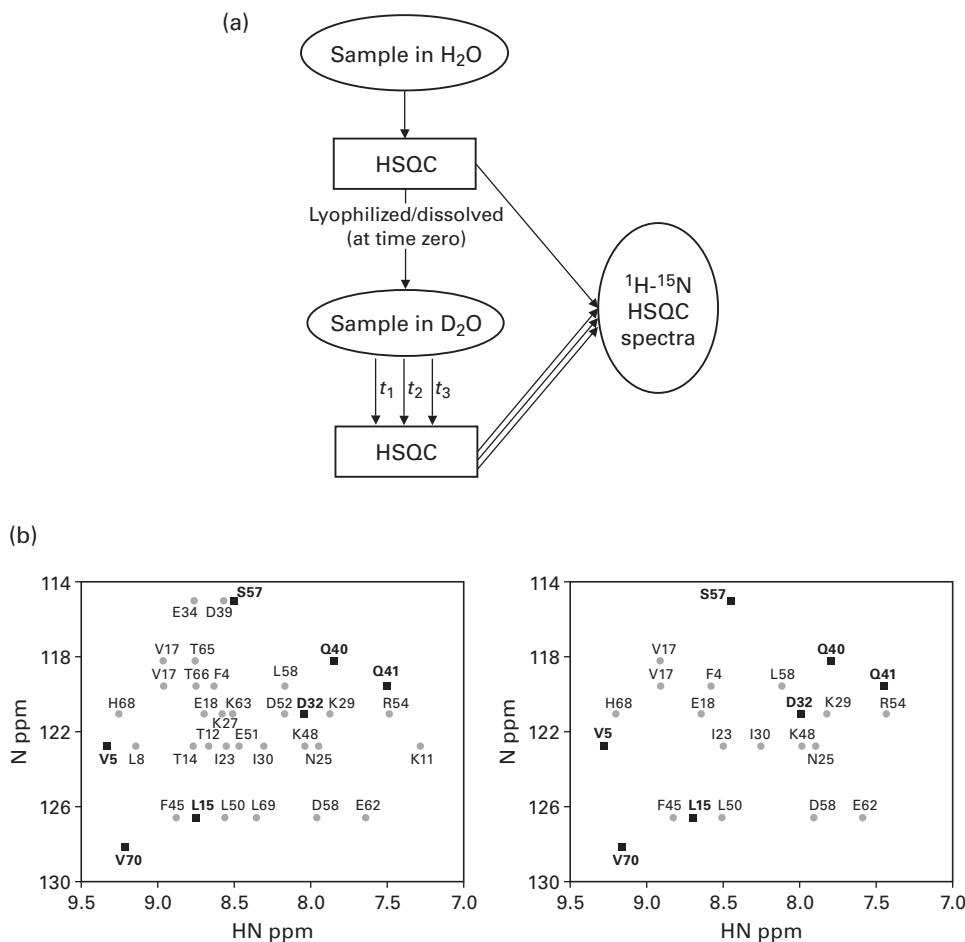
Figure 43.1 Extracting ubiquitin HX rates by HSQC. (a) Data in collected with increments in 10 minutes. The sample was then lyophilized overnight and brought back to its original volume with 99.9% at pH 6.0, and immediately returned to the spectrometer for rapid collection of a series of Hadamard spectra. The positions of excited frequencies are shown in dark black. (Residue I36 at 6.1 ppm, 123.4 ppm is not included in the spectra.) (b) First point after 1 minutes 22 seconds in collected with four scans in 42 seconds. [1, 2]. Reprinted with permission. Copyright 2004 American Chemical Society.
HSQC peak at time . Figure 43.1b shows an example of the loss of peak intensities after dissolving the protein ubiquitin in deuterated water for 1:22 minutes.
Extracting HX Rates by MS
The procedure for extracting HX rates by MS is described in figure 43.2, top. The HX rate measured at each time point is computed by the difference between the centroid of the isotopic peak cluster for the deuterated sample and the centroid of the undeuterated reference. Figure 43.2, bottom shows an example of mass increase after deuterium incorporation.
Correlating HX Rates between NMR and MS
In the following, H denotes a proton, and D denotes a deuteron. The time courses of the exchange from NMR data are calculated by summing the distributions expected for each amino acid. More precisely, the deuteron distribution is computed by
where is the amide proton exchange rate and is the time interval for exchange.
In order to correlate HX rates from NMR and MS, we first plot the time courses of exchange , where is the number of data points in a fragment. Next, we superimpose experimental points from the MS data. A correlation example of deuterium incorporation between the NMR and MS data is shown in figure 43.3.
MS-Assisted Assignment
The following generate-and-test procedure is used in Feng et al. [1] to demonstrate how MS helps NMR resonance assignment:
- Perform an a priori NMR assignment.
- Predict the exchange data for all residues from HSQC.
- Compare the exchange data from HSQC with the data from MS.
- Score the comparison using the function , where is the number of data points, and and are, respectively, deuterium levels from the MS experiment data and the calculation from the NMR data.
Figure 43.4 shows an example of sequential assignment scores for the protein ubiquitin.
MS-Assisted NMR Assignment in Reductively 13C-Methylated Proteins
The approach in Macnaughtan et al. [2] depends on different rates of reductive methylation at each primary amine site. After we run NMR and MS experiments, we can obtain normalized percentages of 13C incorporation from HSQC and MS data, as shown in figure 43.5.
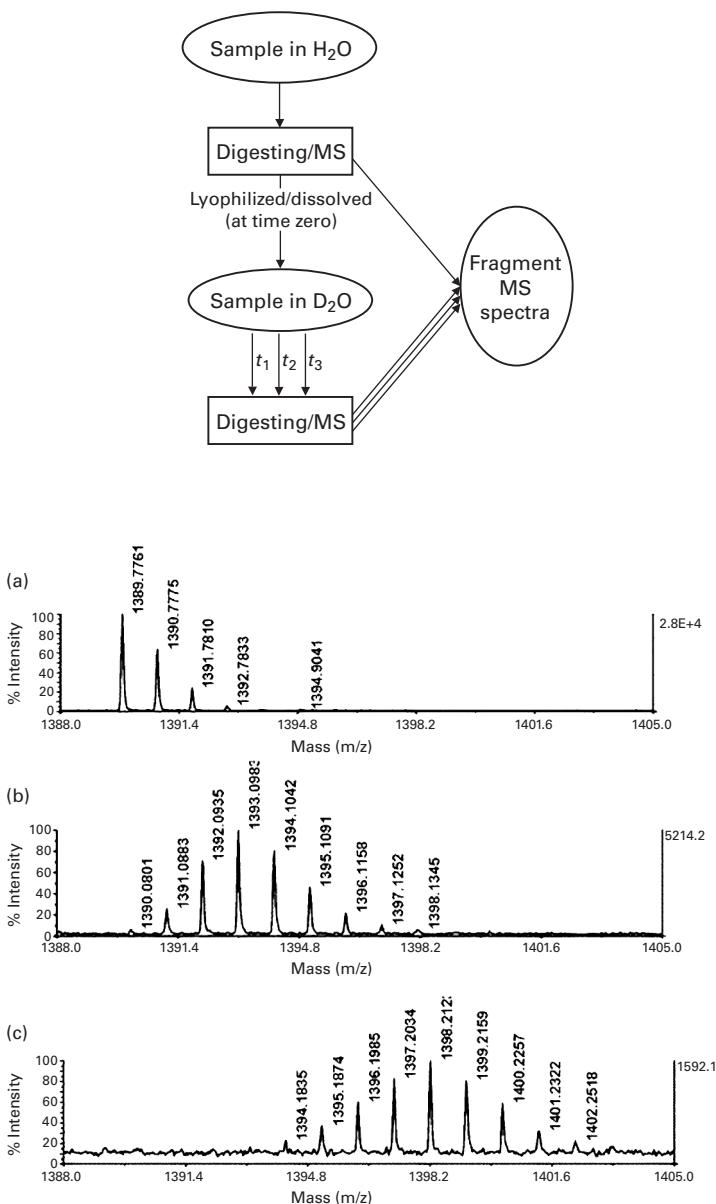
Figure 43.2 Extracting HX rates by MS. Lyophilized ubiquitin was dissolved in buffered with at pH 6.1 and incubated for varying lengths of time at room temperature before quenching and digesting the sample. The mass spectrum shows the region around the peptide of average mass 1,390.4 Da (Residues 346–48: AGKQLEDGRTLSD). The undeuterated spectrum is shown in panel a as a reference. Panels b and c are for exchange times of 1 minute and 4 hours [1, 2]. Reprinted with permission. Copyright 2004 American Chemical Society.
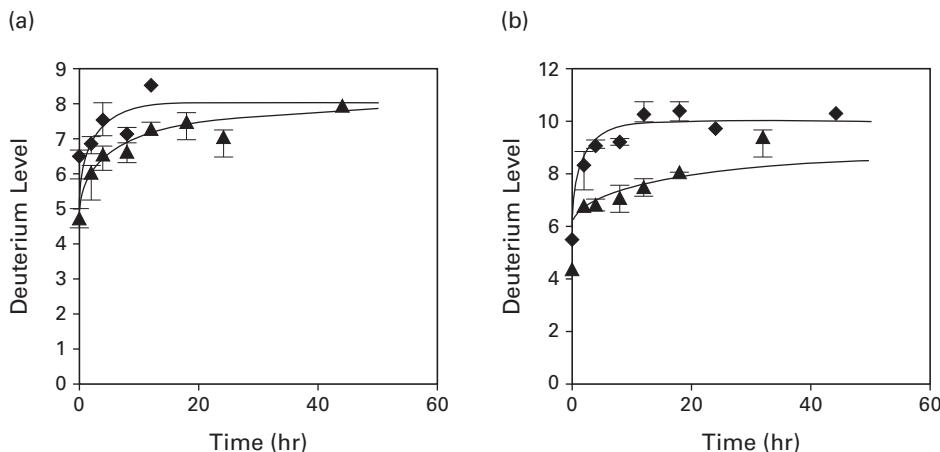
Figure 43.3 The correlation of deuterium incorporation between the NMR and MS data. Correlation of deuterium incorporation from MS data with levels predicted from NMR rate constants for two pairs of peptides from ubiquitin. (a) compares data for the 1,021-Da peptide (▲) and the 1,096-Da peptide (◆). (b) compares the 1,347-Da peptide (◆) and the 1,176-Da peptide (▲). [1, 2]. Reprinted with permission. Copyright 2004 American Chemical Society.
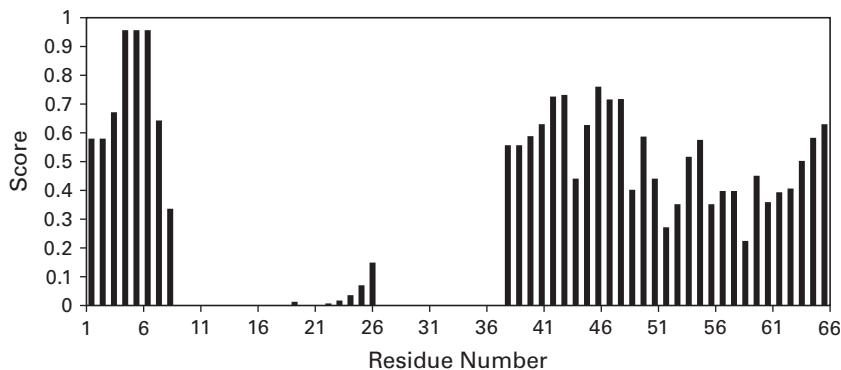
Figure 43.4 The sequential assignment scores for peptide 1,175.5 of ubiquitin. (Residues #5–15). The highest scores are seen near the proper placement position (4–6) [1, 2]. Reprinted with permission. Copyright 2004 American Chemical Society.
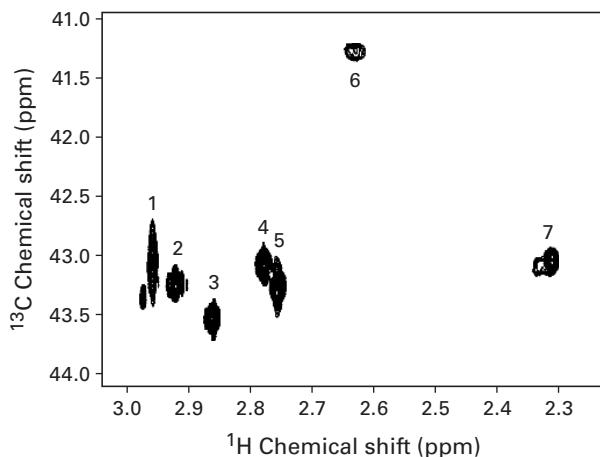
Table 1. Normalized Peak Volumes from - HSQC Spectra of the Four Partially -Labeled Samples
| NMR peak | 0.5:1 sample | 1:1 sample | 2:1 sample | 5:1 sample |
|---|---|---|---|---|
| 1 | 9.9 | 18.0 | 33.7 | 71.4 |
| 2 | 8.8 | 12.8 | 25.3 | 61.1 |
| 3 | 11.6 | 17.3 | 32.0 | 70.3 |
| 4 | 5.2 | 7.5 | 15.4 | 38.6 |
| 5 | 8.8 | 11.9 | 26.1 | 60.0 |
| 6 | 10.7 | 30.2 | ||
| 7 | 19.9 | 21.5 | 34.7 | 78.3 |
aThe molar ratio of -formaldehyde to primary amine used in the reductive methylation reaction is used to name each sample.
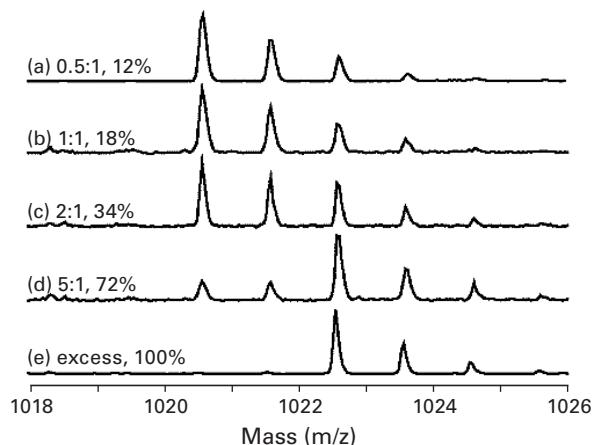
Table 2. Normalized Percentages of Incorporation for Each Peptide Containing Either One or Two Dimethylamines
| Isotope/amine in peptide | 0.5:1 sample | 1:1 sample | 2:1 sample | 5:1 sample |
|---|---|---|---|---|
| N-terminal amine, K1 | 15.4 | 14.1 | 17.9 | 44.8 |
| K13 | 12.1 | 17.7 | 33.6 | 71.5 |
| K33 | 10.5 | 11.5 | 27.6 | 64.5 |
| K96, K97 | 13.2 | 23.0 | 52.1 | |
| K97 | 15.5 | 19.8 | 36.0 | 81.8 |
| K116 | 5.5 | 11.0 | 24.2 | 56.9 |
| K96 (back-calculated) | 4.7 | 11.2 | 23.7 |
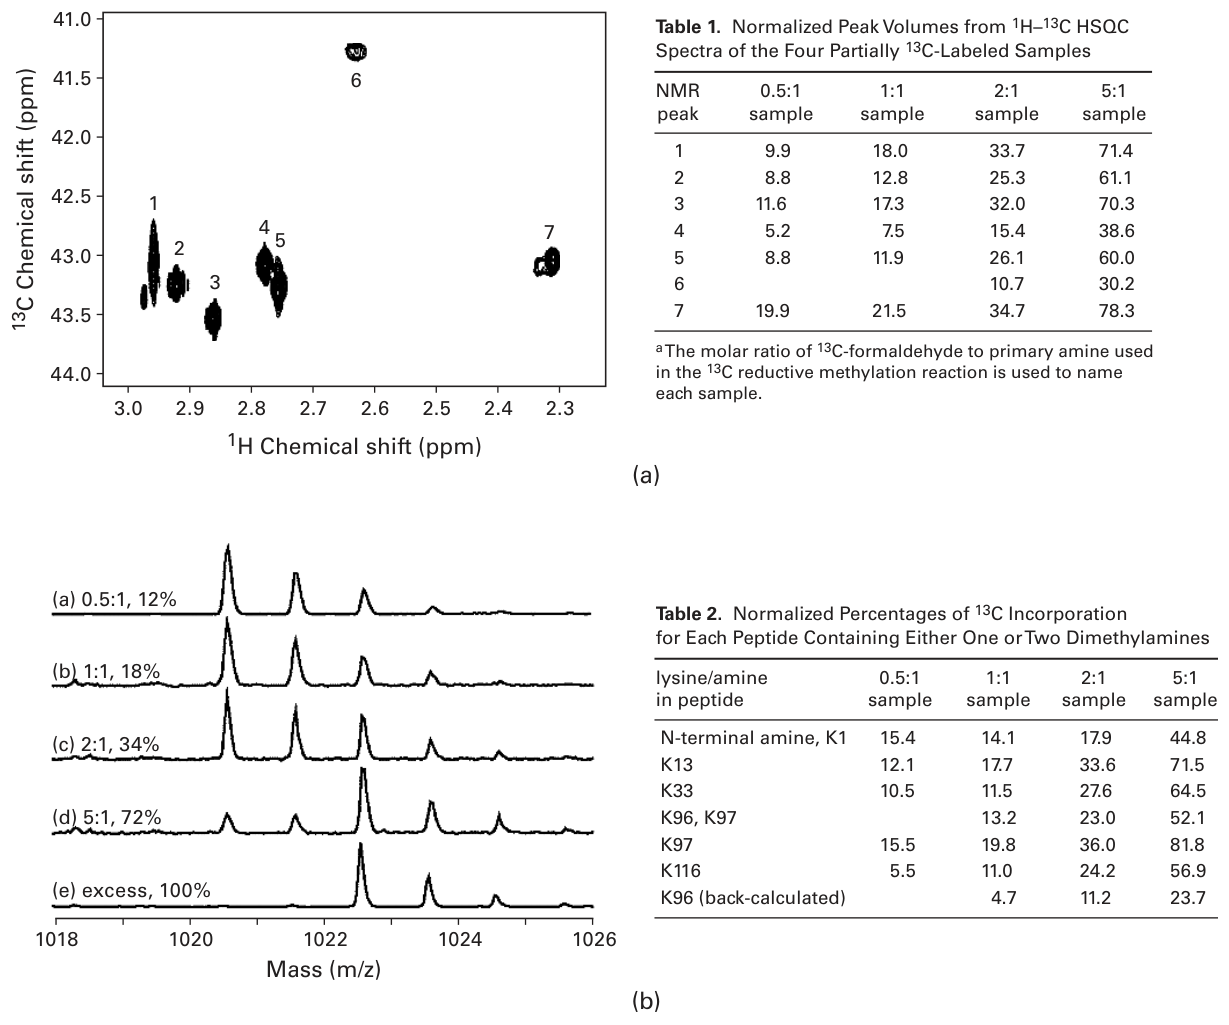
Figure 43.5 The normalized percentages of incorporation. (a) Left: - HSQC of -dimethylated lysozyme at pH 8.1 acquired on a 600-MHz spectrometer in approximately 5 minutes. Right: Normalized peak volumes from - HSQC spectra of the four partially -labeled samples. The molar ratio of -formaldehyde to primary amine used in the reductive methylation reaction is used to name each sample. (b) Left: MS isotope profiles for the tryptic peptide containing a single dimethyllysine (Residues #6-14 CELAAAMKR) at various reaction stoichiometries. The reaction conditions in moles of -formaldehyde relative to the moles of reactive amines are listed along with the normalized percentages of incorporation calculated from the profiles. Right: Normalized percentages of incorporation for each peptide containing either one or two dimethylamines [1, 2]. Reprinted with permission. Copyright 2005 American Chemical Society.
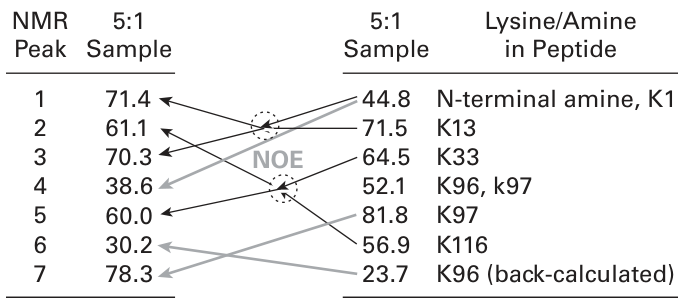
Figure 43.6 The assignment of NMR peaks (the “5:1 sample” means that the molar ratio of -formaldehyde to primary amine in the sample is 5 : 1) [1, 2]. Reprinted with permission. Copyright 2005 American Chemical Society.
The NMR peak assignment can be performed by comparing the NMR and MS percentages of incorporation, as illustrated in figure 43.6.
Exercise Figure 43.6 appears to define a matching problem similar to bipartite matching. Explain how the Hungarian algorithm, EM, or graph cuts could be applied to solve this problem.
References
[1] L. Feng, R. Orlando, and J. H. Prestegard. Mass spectrometry assisted assignment of NMR resonances in labeled proteins. Journal of the American Chemical Society 126(2004):14377–14379.
[2] Megan A. Macnaughtan, Austin M. Kane, and James H. Prestegard. Mass Spectrometry Assisted Assignment of NMR Resonances in Reductively -Methylated Proteins. Journal of the American Chemical Society 127;50(2005):17626–17627.