Chapter 12Inheritance, Genes, and Chromosomes
Key Concepts
12.1 Inheritance of Genes Follows Mendelian Laws
12.2 Alleles Can Produce Multiple Phenotypes
12.3 Genes Can Interact to Produce a Phenotype
12.4 Genes Are Carried on Chromosomes
12.5 Some Eukaryotic Genes Are Outside the Nucleus
12.6 Prokaryotes Can Transmit Genes by Mating
Red hair runs in families.
© Picture Partners/Alanny Stock Photo
Investigating Life: What Are the Rules of Inheritance?
Red hair is the rarest natural hair color in humans, with a frequency of about 1%. It is most common in northern Europe, with Scotland leading at a frequency of about 15%. Throughout history people have attempted to find a correlation between red-headedness and other traits. Red hair and hot temper, for example, are often associated. A recent study by the Hamburg Research Institute in Germany on the sexual activity of hundreds of women came to the conclusion that redheads were having more sex than any other hair color group. Attempts have been made to prove that redheads have a lower tolerance to pain than do people with other hair colors.
Given the rarity of red hair, it is not surprising that it was an early subject of investigation in genetics, the science of heredity. As you will see in this chapter, the foundations of modern genetics were laid late in the nineteenth century through careful experimentation on pea plants by Gregor Mendel. By the early twentieth century, biologists examining human families noticed that red-haired children were usually born from (1) two red-haired parents, (2) one parent with dark hair and one with red, or (3) two dark-haired parents. This fit the pattern for recessive inheritance, in which the gene that determines red hair can be masked by a dominant gene for dark hair. Exceptions were noted, however, and how red hair is inherited was uncertain until the late 1950s, when Brenda Ellis took a genetics course from Professor Ralph Singleton at Wake Forest University in North Carolina.
After hearing her professor discuss theories about the inheritance of red hair, Ellis investigated her family tree dating back six generations, noting which relatives had red hair. She surmised that all the redheads in her family were the offspring of either two dark-haired parents or one with dark hair and one with red hair. Each of the dark-haired people had a red-haired ancestor and were presumably carriers of a gene that determines red hair. The genetic explanation that Ellis and her professor gave for the striking pattern of recessive inheritance of red hair in her family has since become widely accepted.
Sometimes, however, red hair pops up in families with no genetic history of red hair. In this chapter we examine various patterns of inheritance and the genetic mechanisms by which they arise.
QAA How do inherited characteristics such as red hair skip generations? (Find the answer on page 270.)
Inheritance of Genes Follows Mendelian Laws
Learning Objectives
- 12.1.1 Explain how Mendel’s crosses supported particulate inheritance but not blending inheritance.
- 12.1.2 Distinguish between a dominant and a recessive trait.
- 12.1.3 State Mendel’s laws of inheritance and explain how meiosis can account for them.
- 12.1.4 Predict the results of a cross using a Punnett square.
- 12.1.5 Apply probability concepts to predict the results of crosses involving genes on different chromosomes.
- 12.1.6 Determine the inheritance of a trait using human pedigrees.
Genetics, the field of biology concerned with inheritance, has a long history. There is good evidence that people were deliberately breeding animals (horses) and plants (the date palm tree) for desirable characteristics as long as 5,000 years ago. The general idea was to examine the natural variation among the individuals of a species and “breed the best to the best and hope for the best.” While this was a hit-or-miss method—sometimes the resulting offspring had all the good characteristics of the parents, but sometimes they did not—it was quite successful, resulting in many of the common domesticated plants and animals we see today.
By the mid-nineteenth century, two theories had emerged to explain the results of breeding experiments:
- The hypothesis of blending inheritance proposed that gametes (sex cells such as eggs or sperm) contained hereditary determinants (what we now call genes) that blended when the gametes fused during fertilization. Like inks of different colors, the two different determinants lost their individuality after blending and could never be separated. For example, if a plant that made smooth, round seeds was crossed (bred) with a plant that made wrinkled seeds, the offspring would be intermediate between the two and the determinants for the two parental characteristics would be lost.
- The hypothesis of particulate inheritance proposed that each determinant had a physically distinct nature; when gametes fused in fertilization, the determinants remained intact. According to this hypothesis, if a plant that made round seeds was crossed with a plant that made wrinkled seeds, the offspring (no matter the shape of their seeds) would still contain the determinants for the two characteristics.
The story of how these competing hypotheses were tested provides a striking example of how the scientific method can be used to support one theory and reject another. In the following sections we look in detail at experiments performed in the 1860s by an Austrian monk and scientist, Gregor Mendel, whose work clearly supported the particulate hypothesis.
Mendel’s laws arose from controlled crosses of pea plants
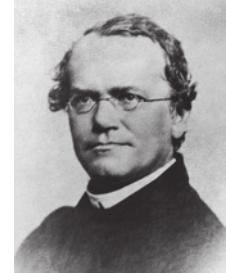
After entering the priesthood at a monastery in Brno, in what is now the Czech Republic, Gregor Mendel was sent to the University of Vienna, where he studied biology, physics, and mathematics. He returned to the monastery in 1853 to teach. The abbot in charge had set up a small plot of land to do experiments with plants and encouraged Mendel to continue with the experiments. Over seven years, Mendel made crosses with many thousands of plants. Analysis of his meticulously gathered data suggested to him that inheritance was due to particulate factors.
Mendel presented his theories in two public lectures in 1865 and a detailed written publication in 1866, but his work was ignored by mainstream scientists until 1900. By that time, the discovery of chromosomes had suggested to biologists that genes might be carried on chromosomes. When they read Mendel’s work on particulate inheritance, the biologists connected the dots between genes and chromosomes.
Mendel chose to study the common garden pea (Pisum sativum) because it has many features that make it ideal for addressing questions concerning inheritance, including (1) variability in one or more easily scorable characters, (2) large family sizes, (3) short generation times, (4) the ability to be grown easily and inexpensively, and (5) suitability for controlled matings. Pea flowers have both male and female sex organs: stamens and pistils, which produce gametes, sperm and eggs, that are contained within the pollen and ovules, respectively (Figure 12.1). Pea flowers normally self-fertilize. That is, male and female gametes on the same flower combine. However, the male organs can be removed from a flower so that it can be manually fertilized with pollen from a different flower. That’s what Mendel did.
There are many varieties of pea plants with easily recognizable characteristics. A character is an observable physical feature, such as seed shape. A trait is a particular form of a character, such as round or wrinkled seeds. The traits expressed by an individual at one or more characters contribute to its phenotype—the observable properties of an individual resulting from both genetic and environmental factors. Mendel worked with varieties with contrasting traits for seven characters, such as seed shape, seed color, and flower color. These varieties were true-breeding: that is, when
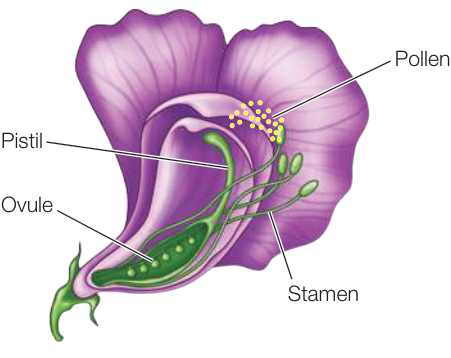
Figure 12.1 A Pea Flower Pea flowers have pollen-producing organs called stamens and an ovule-producing organ called the pistil.
Mendel crossed (moved pollen between) a plant that produced wrinkled seeds for example with another of the same variety, all of the offspring plants produced wrinkled seeds.
As you will see, Mendel proposed a set of hypotheses to explain the inheritance of particular pea traits, and then designed crossing experiments to test his hypotheses. He performed his crosses in the following manner:
- He removed the stamens (male parts) from flowers of one parental variety so that it couldn’t self-fertilize. Then he collected pollen from another parental variety and placed it on the pistils of the emasculated flowers. The plants providing and receiving the pollen were the parental generation, designated P.
- In due course, seeds formed and were planted. The seeds and the resulting new plants constituted the first filial generation, or F1. (The word “filial” refers to the relationship between offspring and parents, from the Latin filius, “son.”) Mendel examined each F1 plant to see which traits it bore and then recorded the number of F1 plants expressing each trait.
- In some experiments the F1 plants were allowed to self-pollinate and produce a second filial generation, or F2. Again, each F2 plant was characterized and counted.
Mendel’s first experiments involved monohybrid crosses
When parents of different species or of different varieties of the same species are crossed, the resulting offspring are termed “hybrids.” In Mendel’s first experiments, he crossed parental (P) varieties with contrasting traits for a single character, producing monohybrids (from the Greek monos, “single”) in the F1 generation. He subsequently planted the F1 seeds and allowed the resulting plants to self-pollinate to produce the F2 generation. This technique is referred to as a monohybrid cross.
Mendel performed the equivalent experiment for seven pea characters. You can follow his method in Investigating Life: Mendel’s Monohybrid Experiments, using seed shape as an example. When he crossed a variety with round seeds to one with wrinkled seeds, all of the F1 seeds were round—it was as if the wrinkled seed trait had disappeared completely. However, when F1 plants were allowed to self-pollinate to produce F2 seeds, about one-fourth of the seeds were wrinkled. These crosses were key to distinguishing the blending and particulate theories:
- The F1 offspring were not a blend of the two traits of the parents. Only one of the traits was present (in this case, round seeds).
- Some F2 offspring had wrinkled seeds. The trait had not disappeared because of blending.
These observations led to a rejection of the blending theory of inheritance and provided support for the particulate theory. We now know that hereditary determinants are not actually “particulate,” but they are physically distinct entities: sequences of DNA carried on chromosomes, which we now call genes.
All seven crosses between varieties with contrasting traits gave the same pattern of data (Table 12.1). In the F1 generation only one of the two traits was seen, but the other trait reappeared in about one-fourth of the offspring in the F2 generation. Mendel called the trait that appeared in the F1 and was more abundant in the F2 the dominant trait, and the other trait recessive. In the F2 generation, the ratio of plants exhibiting dominant versus recessive traits was about 3:1. (To calculate the ratios shown in Table 12.1, divide the number of F2 plants with each trait by the number with the recessive trait.)
Table 12.1 Mendel’s Results from Monohybrid Crosses
Investigating Life: Mendel’s Monohybrid Experiments
Experiment
Original Paper: The original German version of Mendel’s paper, Versuche über Pflanzen-Hybriden, with an English translation and extensive explanatory notes, is available online: mendelweb.org/Mendel.plain.html.
Mendel performed crosses with pea plants and carefully analyzed the outcomes to show that genetic determinants are particulate.
HYPOTHESIS When two strains of peas with contrasting traits are bred, their characteristics are irreversibly blended in succeeding generations.
METHOD
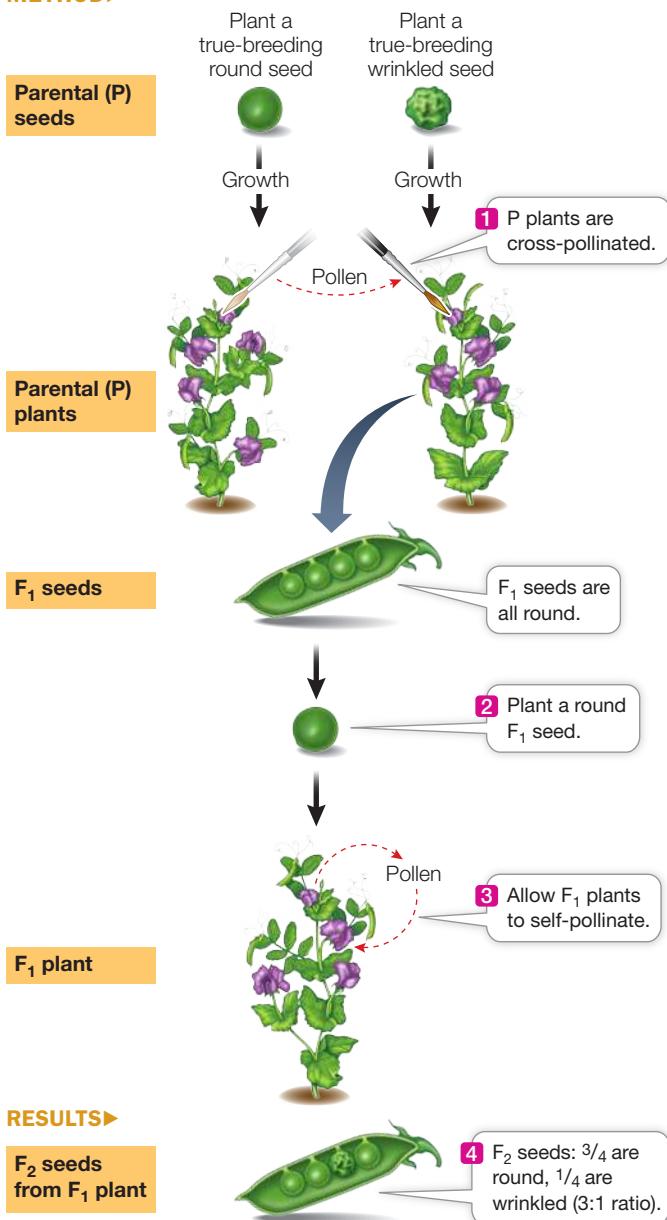
CONCLUSION The hypothesis is rejected. There is no irreversible blending of characteristics, and a parental trait that was absent in the can reappear in succeeding generations.
Work with the Data
Mendel’s monohybrid crosses were key to his rejection of the theory of blending inheritance. While the experiment at left illustrates a monohybrid cross with round and wrinkled seeds, another of his monohybrid crosses was between true-breeding green-seeded and yellow-seeded pea plants. All of the pea plants in the generation of this cross had yellow seeds. Mendel allowed the plants to self-pollinate and then analyzed the seed colors of the resulting generation. The table shows actual data from individual plants in the generation as reported in Mendel’s paper. Mendel made mathematical calculations and presented the overall ratios for these two traits. He did not, however, perform a statistical analysis to determine whether the variations in the data reflected a general pattern of inheritance or were simply due to chance.
| Seed color | ||
|---|---|---|
| Plant | Yellow | Green |
| 1 | 25 | 11 |
| 2 | 32 | 7 |
| 3 | 14 | 5 |
| 4 | 70 | 27 |
| 5 | 24 | 13 |
| 6 | 20 | 6 |
| 7 | 32 | 13 |
| 8 | 44 | 9 |
| 9 | 50 | 14 |
| 10 | 44 | 18 |
QUESTIONS
- Use the hypothesis that the ratio of yellow to green seeds in the generation would be 3:1 and perform a chi-square test to analyze the results for each plant in the table (see Figure B12 in Appendix B for information about using the chi-square test). What can you conclude about this hypothesis from the individual plants? How many crosses have -values ?
- Now total the data from all the plants and rerun the chi-square analysis. Do your conclusions change? In terms of the expected phenotypic ratio, what does your analysis indicate about the need for using a large number of organisms in studies of genetics?
You can see in Table 12.1 that for each character, Mendel counted hundreds or even thousands of seeds or plants to see how many exhibited each trait. As we will discuss in more detail later in this key concept, the probability of a plant inheriting a particular trait is independent of the probability of another plant inheriting the same trait. If Mendel had looked at only a few progeny from the “round round” cross, he might, by chance, have found only round seeds. Or he might have found a higher proportion of wrinkled seeds than he did. In order to discover underlying patterns and to develop his laws of inheritance, Mendel used very large numbers of plants.
Mendel went on to expand on the particulate theory. He proposed that hereditary determinants—which we will refer to as genes, although Mendel did not use that term—occur in pairs and segregate (separate) from one another during the formation of gametes. He concluded that each pea plant has two copies of the gene for each character (such as seed shape), one inherited from each parent. We now use the term diploid (2n) to describe the state of having two copies of each gene; haploids (n) have just a single copy. You saw these terms in Chapter 11 when you learned about the cell cycle and meiosis.
Mendel concluded that while each gamete contains one copy of each gene, the resulting zygote contains two copies, because it is produced by the fusion of two gametes. Furthermore, he surmised that different traits arise from different forms of a gene (now called alleles) for a particular character. For example, Mendel studied two alleles for seed shape: a dominant allele for round seeds and a recessive allele for wrinkled seeds.
- An organism that is homozygous for a gene has two alleles that are the same (for example, two copies of the allele for round seeds).
- An organism that is heterozygous for a gene has two different alleles (for example, one allele for round seeds and one allele for wrinkled seeds).
In a heterozygote, one of the two alleles may be dominant (such as round, ) and the other recessive (wrinkled, ). By convention, dominant alleles are designated with uppercase letters and recessive alleles with lowercase letters. Note that the terms dominant and recessive refer only to which phenotype is expressed when the two alleles are present together. They do not refer to which alleles are stronger, better, or more common.
Mendel proposed that an individual’s phenotype is the result of its genotype, or genetic constitution. Round seeds and wrinkled seeds are two phenotypes resulting from three possible genotypes: the wrinkled seed phenotype is produced by the genotype , whereas the round seed phenotype is produced by either genotype or (because the allele determines the dominant round trait and the allele determines the recessive wrinkled trait).
Mendel’s first law states that the two copies of a gene segregate
How do Mendel’s theories explain the proportions of traits seen in the and generations of his monohybrid crosses? Mendel’s first law—the law of segregation—states that when any individual produces gametes, the two copies of a gene separate, so that half of the gametes receive one copy and half receive the other copy. Thus gametes from a parent with the genotype will all carry the allele; gametes from an parent will all carry the allele. In an individual, half the gametes will carry the allele and the other half will carry . What genotypes are produced when these gametes fuse to form the next generation? The allele combinations that will result from a cross can be predicted using a Punnett square. This device ensures that you consider all possible combinations of gametes when calculating expected genotype frequencies of the resulting offspring. A Punnett square is a simple grid with all possible male gamete (haploid sperm) genotypes shown along the top and all possible female gamete (haploid egg) genotypes along the left side. The grid is completed by filling in each square with the diploid genotype that is generated from each combination of gametes.
Let’s use a Punnett square to derive the progeny of an cross (Figure 12.2). To determine the genotypes in the generation, into each square we put an from the male gamete (a sperm cell from the pollen tube) and an from the female gamete (the egg cell). All the offspring of this cross (the generation) have the
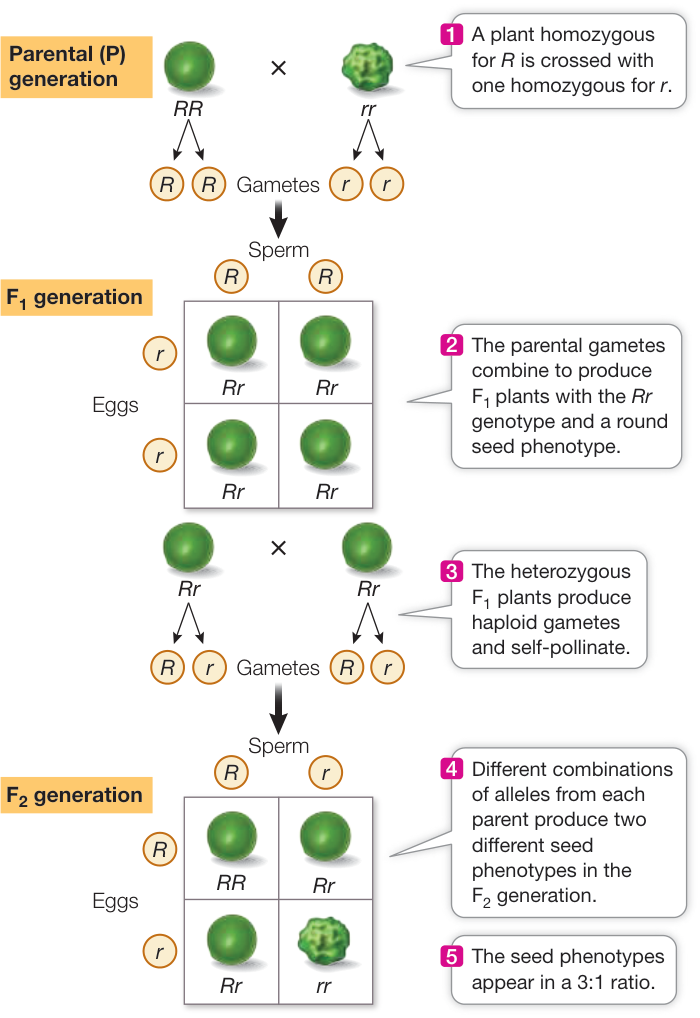
Figure 12.2 Mendel’s Explanation of Inheritance Mendel concluded that inheritance depends on discrete factors from each parent that do not blend in the offspring.
Rr genotype, which produces seeds with a round phenotype. What happens when the generation are crossed among themselves to produce the generation? Once the Punnett square is filled in, we readily see that the four combinations of gametes give three possible genotypes (RR, Rr, and rr) in a 1:2:1 ratio if all combinations are equally likely. Since the R allele is dominant, such that RR and Rr both give round seeds, we predict a 3:1 ratio of the round and wrinkled phenotypes in the generation, which is remarkably close to the ratios Mendel found experimentally for all the traits he compared (see Table 12.1). Mendel’s 3:1 ratio is thus explained by all four combinations in the Punnett square being equally likely, which requires that R and r are equally frequent in gametes of Rr individuals, which is equal segregation.
Mendel did not live to see his theories placed on a sound physical footing with the discoveries of chromosomes and DNA. Genes are now known to be sequences of DNA found on the much longer DNA molecules that make up chromosomes. With your knowledge of meiosis, you can envision the different alleles of a gene segregating as chromosomes separate during meiosis I (Figure 12.3). Since Mendel’s first law is a result of events that occur during anaphase I of meiosis, it is perhaps not surprising that it has been found to hold in all meiotic organisms for almost every single gene.
We know now that genes determine phenotypes mostly by producing proteins with particular functions, such as enzymes. In many cases a dominant gene is expressed (transcribed and translated) to produce a functional protein, while a recessive gene is mutated so that it is no longer expressed, or it encodes a mutant protein that is nonfunctional. For example, the wrinkled seed phenotype of rr peas is caused by the absence of an enzyme called starch branching enzyme I (SBE1), which is essential for starch synthesis. With less starch, the developing seed has more sucrose, and this causes an inflow of water by osmosis. When the seed matures and dries out, the water is lost, leaving a shrunken seed. A single copy of the R allele produces enough functional SBE1 to prevent the wrinkled phenotype, which accounts for the dominance of R over r.
Mendel verified his hypotheses by performing test crosses
Mendel arrived at his laws of inheritance by developing a series of hypotheses and then designing experiments to test them. One hypothesis was that there are two possible allele combinations (RR or Rr) for seeds with the round phenotype. Mendel verified this hypothesis by performing test crosses with seeds derived from a variety of other crosses. A test cross is used to determine whether an individual showing one or more dominant traits is homozygous or heterozygous for each gene. The individual in question is crossed with an individual that is homozygous for recessive alleles at each gene—easy to identify, because all individuals with the recessive phenotypes are homozygous for those traits.
The recessive homozygote for the seed shape gene has wrinkled seeds and the genotype rr. The round individual being tested may be described initially as . We can predict two possible results:
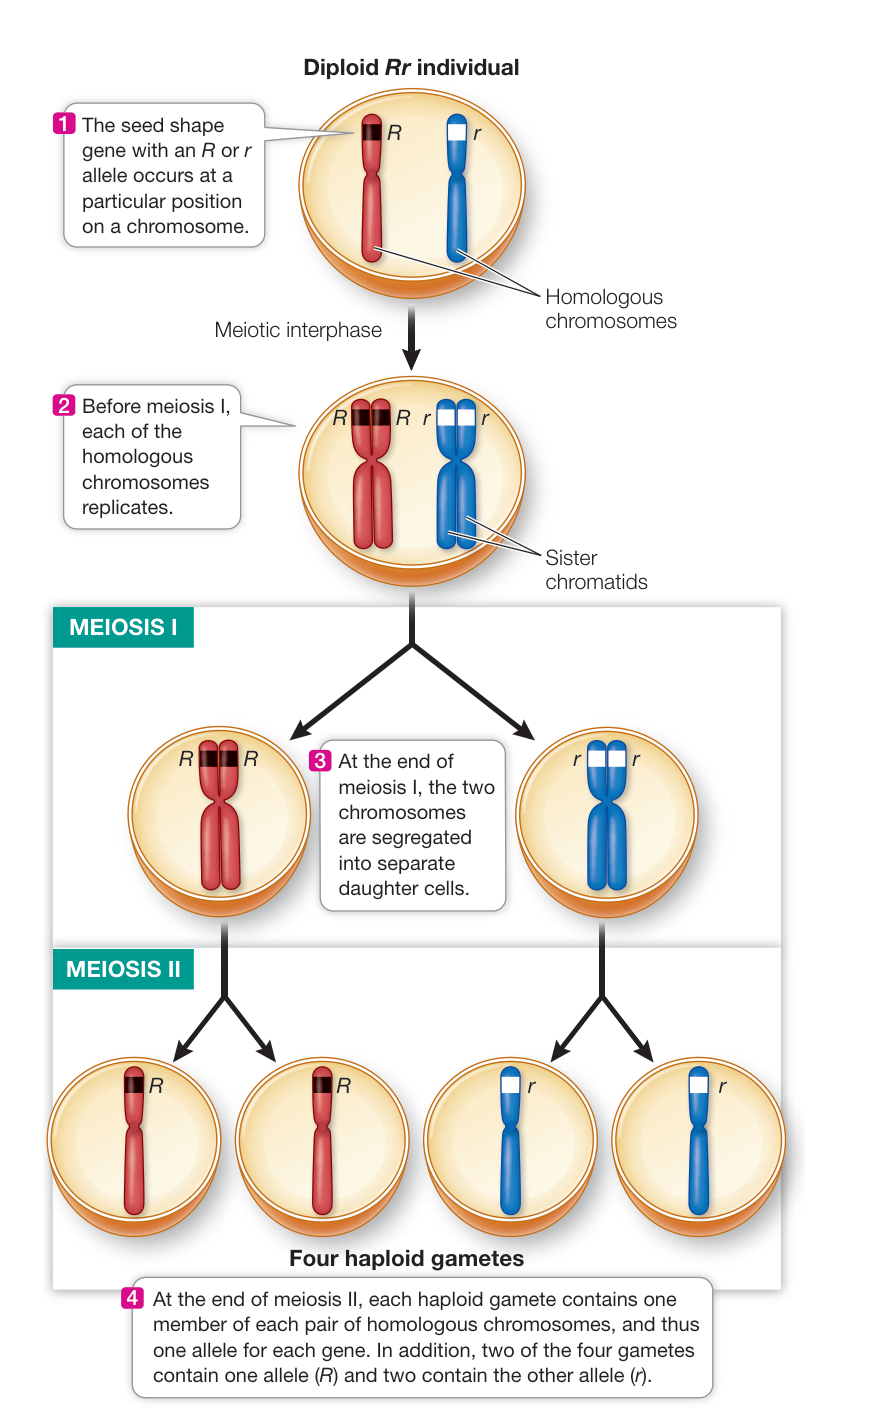
Figure 12.3 Meiosis Accounts for the Segregation of Alleles Although Mendel had no knowledge of chromosomes or meiosis, we now know that a pair of alleles resides on homologous chromosomes, and that those alleles segregate during meiosis. Q: Cells in a pea leaf have 14 chromosomes. How many chromosomes are in each gamete?
- If the individual being tested is homozygous dominant (RR), all offspring of the test cross will be Rr and show the dominant trait (round seeds) (Figure 12.4, left).
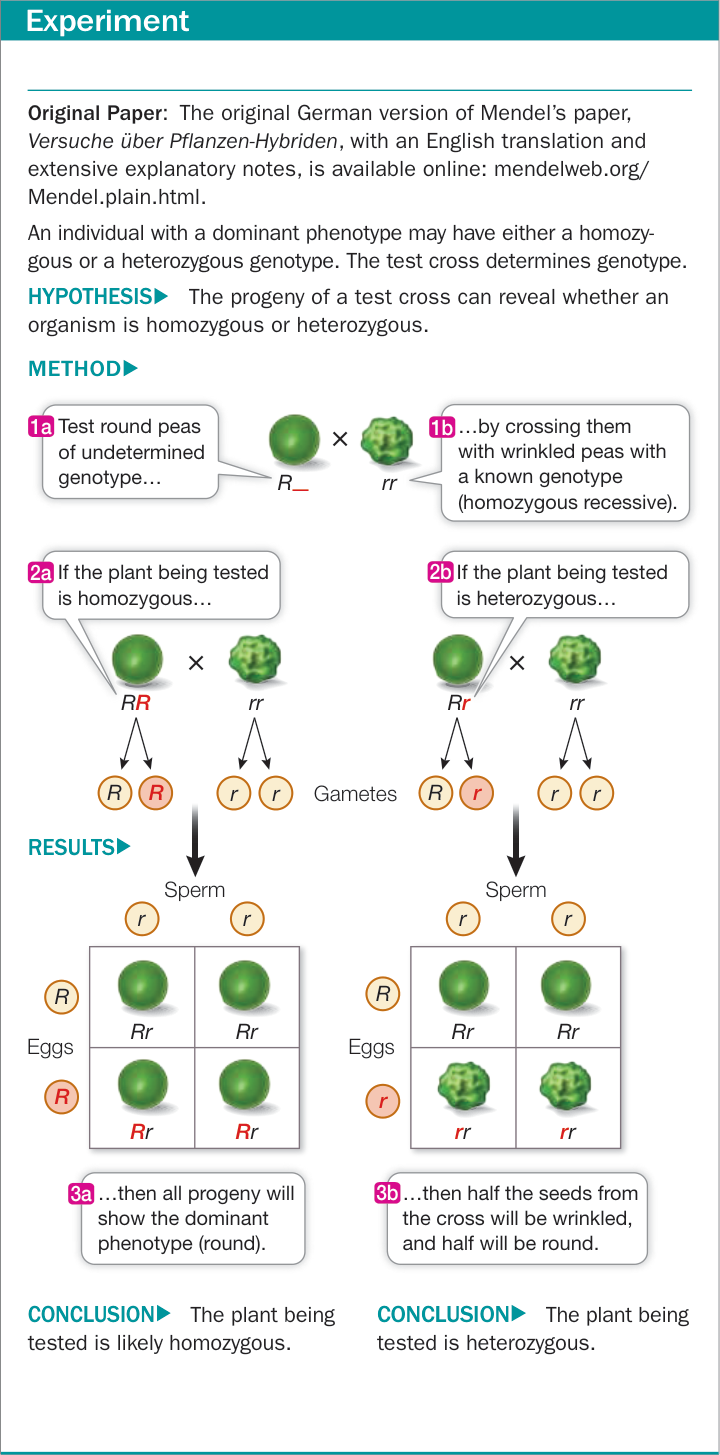
Figure 12.4 Homozygous or Heterozygous?
- If the individual being tested is heterozygous (), then approximately half of the offspring of the test cross will be heterozygous () and show the dominant trait, and the other half will be homozygous for the recessive allele () and show the recessive trait (Figure 12.4, right).
Mendel obtained results consistent with both of these predictions; thus his hypothesis accurately predicted the results of his test crosses.
Mendel’s second law states that copies of different genes assort independently
Now let’s consider inheritance patterns involving two different genes. Consider an organism that is heterozygous for genes for seed shape (round or wrinkled) and seed color (yellow or green). In our example, the dominant and alleles came from one parent, and the recessive and alleles came from the other parent. When this organism produces gametes, do the and alleles always go together in one gamete, and the and alleles in another? Or can a single gamete receive one recessive and one dominant allele ( and or and )?
Mendel performed another series of experiments to answer these questions. He began with peas that differed in two characters: seed shape and seed color. One parental variety produced only round, yellow seeds (), and the other produced only wrinkled, green ones (). A cross between these two varieties, a dihybrid cross, produced an generation in which all the
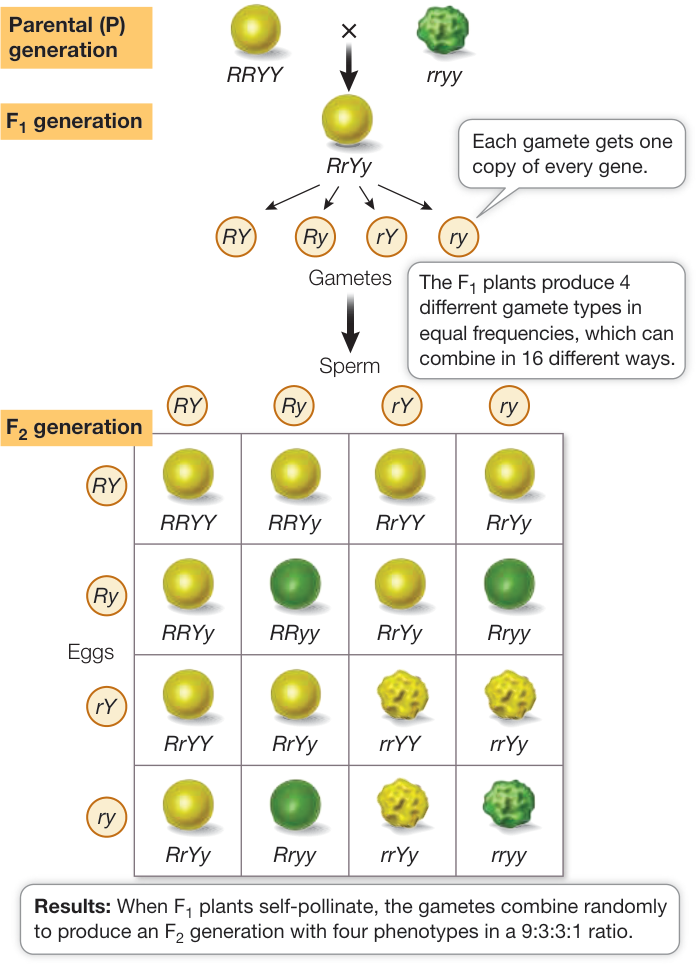
Figure 12.5 Independent Assortment in a Dihybrid Cross The 16 possible combinations of gametes in the cross result in nine different genotypes. Because and are dominant over and , respectively, the nine genotypes result in four phenotypes in a ratio of 9:3:3:1. These results show that the two genes segregate independently.
Media Clip 12.1 Mendel’s Discoveries Life12e.com/mc12.1 plants were . Because the and alleles were dominant, the seeds were all round and yellow.
Mendel continued this experiment into the generation by crossing individuals. In this case, he simply allowed the plants, which were all double heterozygotes, to self-pollinate. Depending on whether the alleles of the two genes are inherited together or separately, there are two possible outcomes:
- The alleles could maintain the associations they had in the parental generation—that is, the genes could be linked. If this were the case, the plants would produce two types of gametes ( and ). The progeny resulting from self-pollination of these plants would consist of two phenotypes: round yellow and wrinkled green in a ratio of 3:1, just as in the monohybrid cross.
- The segregation of from could be independent of the segregation of from —the two genes could be unlinked. In this case, four kinds of gametes would be produced in equal numbers: , , , and . When these gametes combine at random, they should produce an generation with four phenotypes (round yellow, round green, wrinkled yellow, and wrinkled green). Putting these possibilities into a Punnett square, we can predict that these four phenotypes would occur in a ratio of 9:3:3:1.
The results supported the second prediction: four different phenotypes appeared in the generation in a ratio of about 9:3:3:1 (Figure 12.5). On the basis of such experiments, Mendel proposed his second law—the law of independent assortment: alleles of different genes assort independently of one another during gamete formation. In the example just discussed, the segregation of the and alleles is independent of the segregation of the and alleles. Mendel’s second law is now understood in the context of meiosis (see Figure 11.15): homologous chromosome pairs segregate independently of one another during the formation of gametes, and so do any two genes located on different chromosome pairs (Figure 12.6). Since the explanation for Mendel’s second law involves genes on different chromosomes, it is perhaps not surprising that gene pairs that are found close together on the same chromosome do not show inheritance patterns that are consistent with this law (see Key Concept 12.4).
Probability can be used to predict inheritance
One key to Mendel’s success was his use of large numbers of plants. By counting many offspring from each cross, he observed clear patterns that allowed him to formulate his theories. After his work became widely recognized, geneticists began using simple probability calculations to predict the ratios of genotypes and phenotypes in the progeny of a given cross or mating. They use statistics
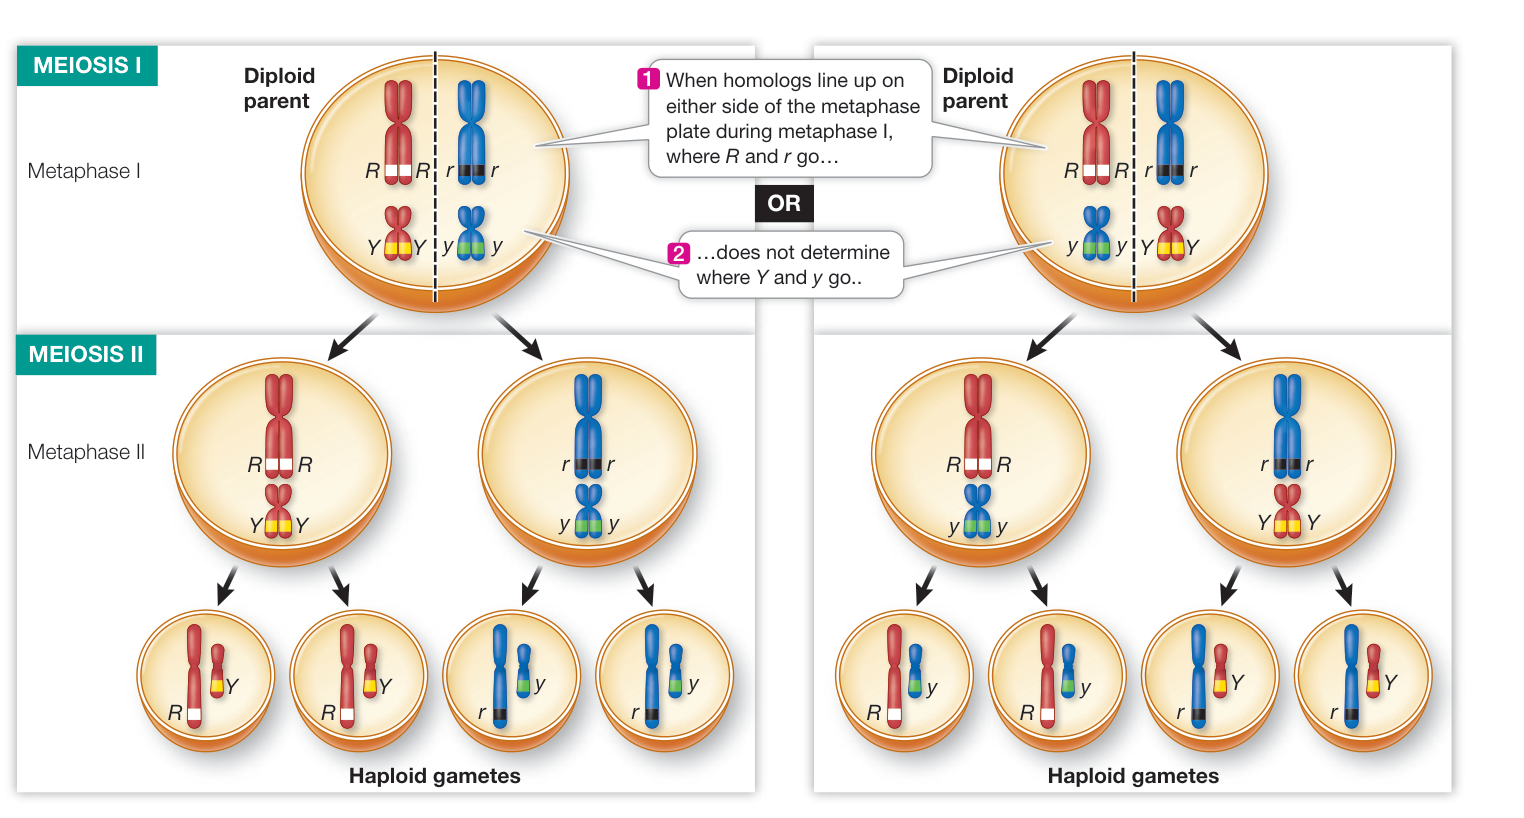
Figure 12.6 Meiosis Accounts for Independent Assortment of Alleles Independent assortment implies that a parent of genotype can form gametes with four different genotypes in equal proportions. This is explained by meiosis if the two possible alignments at metaphase I are equally likely.
Q: A diploid heterozygote for a single gene can produce haploid gametes of only two genetically distinct types. A double heterozygote can produce four genetically distinct types of gametes, as illustrated here. How many genetically distinct gametes could be produced by a quadruple heterozygote if the four genes assort independently? (Answer this without drawing a diagram!)
to determine whether the actual results match the prediction (as explored in the Work with the Data exercise on p. 263).
You can think of probabilities by considering a coin toss. The basic conventions of probability are simple:
- If an event is absolutely certain to happen, its probability is 1.
- If it cannot possibly happen, its probability is 0.
- All other events have a probability between 0 and 1.
There are two possible outcomes of a coin toss, and both are equally likely, so the probability of heads is —as is the probability of tails.
If two coins (say a penny and a dime) are tossed, each acts independently of the other (Figure 12.7). What is the probability of both coins coming up heads? In half of the tosses, the penny comes up heads, and in half of that fraction, the dime comes up heads. The probability of both coins coming up heads is . In general, the probability of two independent outcomes occurring together is found by multiplying the two individual probabilities (the multiplication rule). The multiplication rule can be seen in the results of a monohybrid cross (see Figure 12.2). After the self-pollination of an plant, the probability that an plant will have the genotype is , because the chance that the sperm will have the genotype is , and the chance that the egg will have the genotype is also . Similarly, the probability of obtaining an offspring is also .
Probability can also be used to predict the proportions of phenotypes in a dihybrid cross. Let’s see how this works for the experiment shown in Figure 12.5. Using the principles we just described, you can calculate the probability of an seed being round. This is found by adding the probabilities of obtaining an heterozygote from an sperm and egg (), an heterozygote from an sperm and egg (), and an homozygote from an sperm and egg (): a total of (the addition rule). In general, the probability of either of two independent outcomes occurring is found by adding the two probabilities of each outcome. By the same reasoning, the probability that a seed will be yellow is also . The two characters are determined by separate genes and are independent of each other, so:
- The joint probability for both round and yellow is .
What is the probability of seeds being both wrinkled and yellow? The probability of being yellow is again ; the probability of being wrinkled is , so:
- The joint probability for both wrinkled and yellow is .
By the same reasoning:
- The joint probability for both round () and green () is also .
Finally:
- The joint probability for both wrinkled and green is .
Looking at all four phenotypes, you can see that they are expected to occur in the ratio of 9:3:3:1.
A Punnett square or these simple probability calculations can be used to determine the expected proportions of offspring with particular phenotypes. In the dihybrid cross just discussed, about one-sixteenth of the seeds are expected to be wrinkled and green. But this does not mean that among 16 seeds there will always be exactly 1 wrinkled green seed. For any toss of a coin, the probability of heads is independent of what happened in all the previous tosses. Even if you get three heads in a row, the chance of a head in the next toss is still , and it is quite possible to toss a coin four times and get four heads. But if you toss the coin many times, you are highly likely to get heads in about half of the tosses. If Mendel had examined only a few progeny in each of his crosses, it is unlikely that he would have observed the phenotypic ratios that he did observe. It was his large sample sizes that allowed him to identify the underlying patterns of inheritance, and even these large sample sizes gave slight deviations from the expected ratios (see Table 12.1).
Mendel’s laws can be observed in human pedigrees
Mendel worked out his laws by doing many planned crosses with pea plants and counting many offspring. Neither of these approaches is possible with humans, so human geneticists rely on pedigrees: family trees that show the occurrence of phenotypes (and alleles) in several generations of related individuals. You saw an example of this in the opening story of this chapter. The six-generation pedigree for red hair in Brenda Ellis’s family is shown in Figure 12.8.
Because humans have small numbers of offspring, human pedigrees do not show the clear proportions of phenotypes that Mendel saw in his pea plants. For example, when a man and a woman who are both heterozygous for a recessive allele (say, Aa)
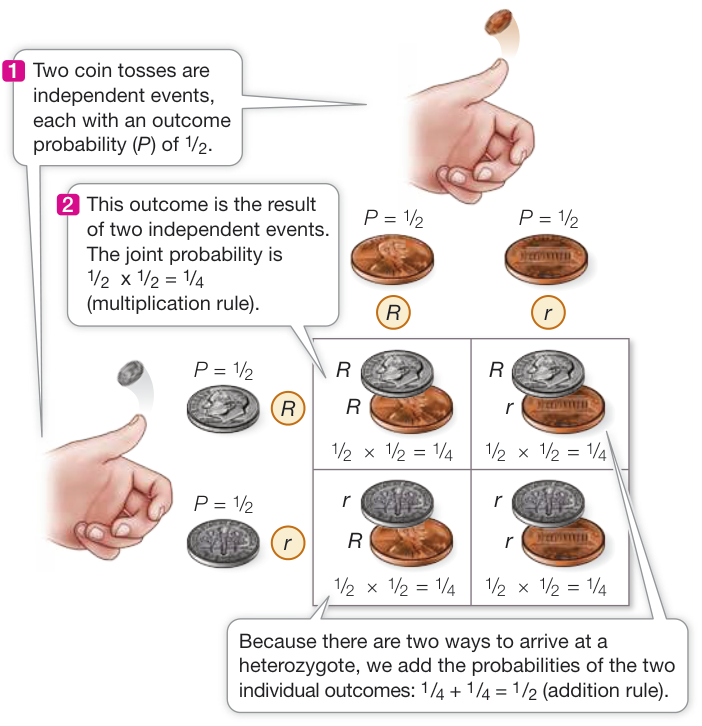
Figure 12.7 Using Probability Calculations in Genetics As with the results of a coin toss, the probability of any given combination of alleles appearing in the offspring of a cross can be obtained by multiplying the probabilities of each event. Since a heterozygote can be formed in two ways, these two probabilities are added together.
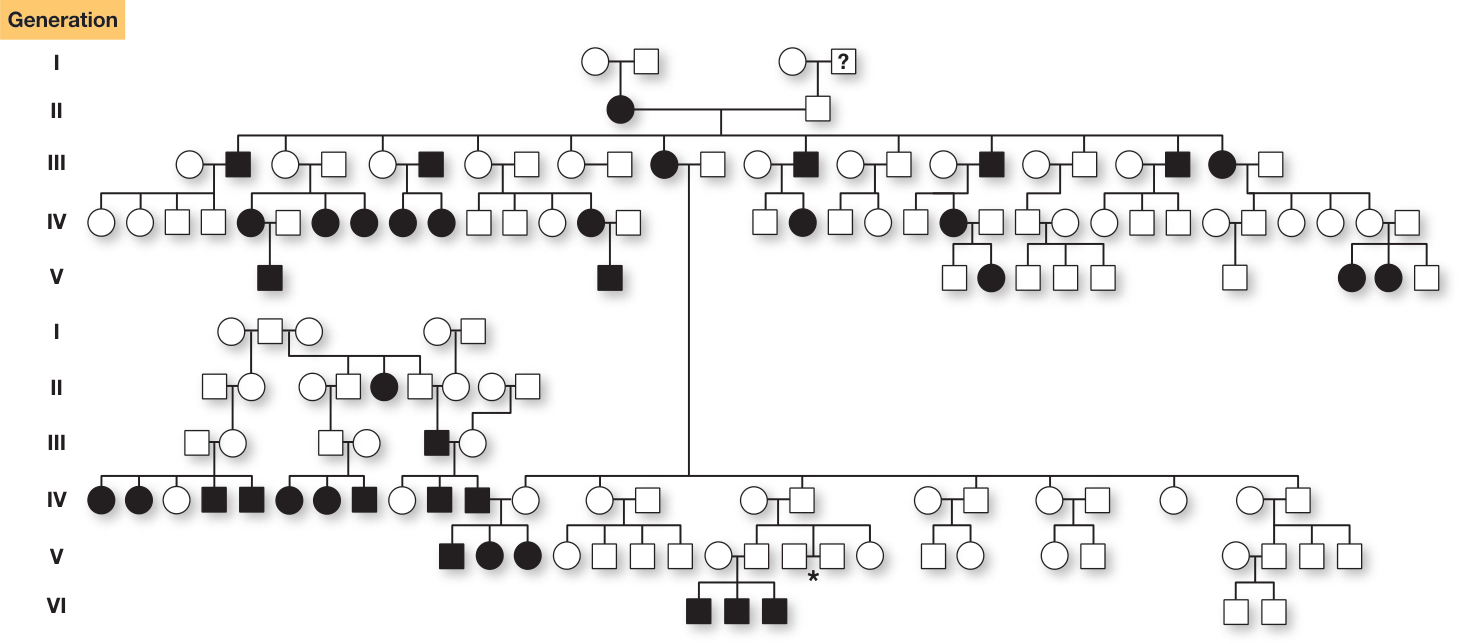
Figure 12.8 The Pedigree for Red Hair for Brenda Ellis’s Family The six-generation pedigree for red hair (filled circles and squares) allowed its inheritance to be determined. *Indicates twin relationship. See Figure 12.9 for explanation of symbols. (After W. R. Singleton and B. Ellis. 1964. J Hered 55: 261, 266.)
have children together, each child has a probability of being a recessive homozygote (aa). If this couple were to have several dozen children, about one-fourth of them would be recessive homozygotes. But the offspring of a single couple are likely to be too few to show the exact one-fourth proportion. In a family with only two children, for example, both children could easily be aa (or Aa, or AA).
Figure 12.9A is a pedigree showing the pattern of inheritance of a disease caused by a dominant allele. The following are the key features to look for in such a pedigree:
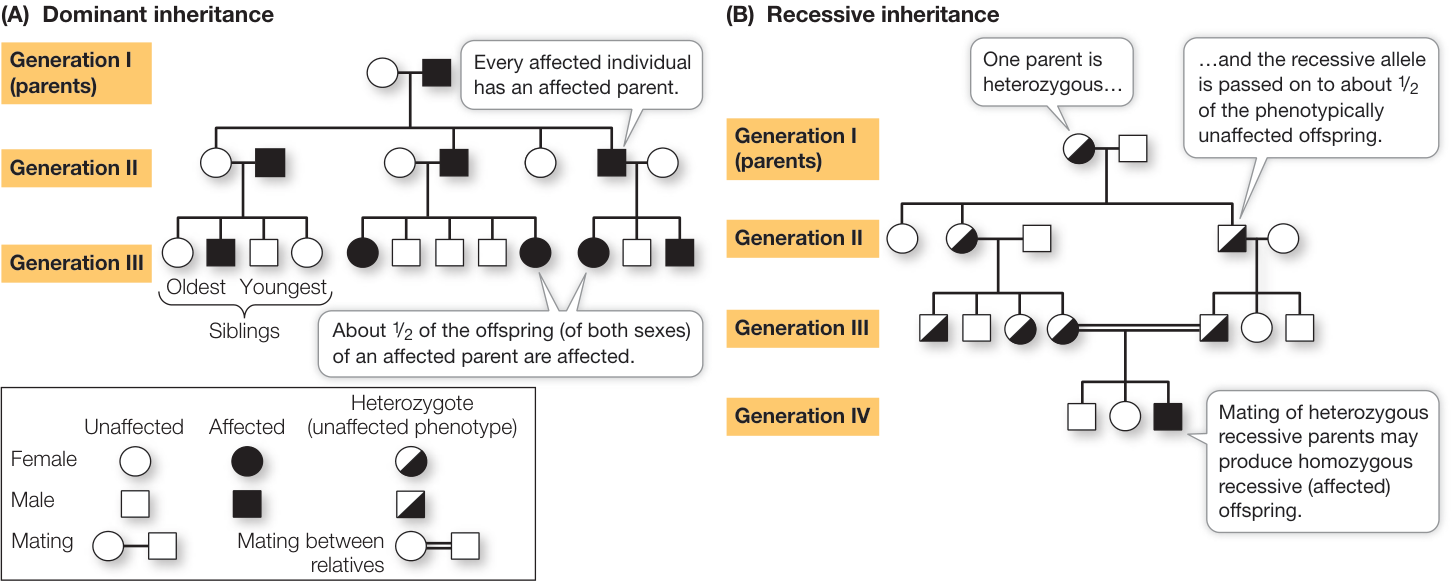
Figure 12.9 Pedigree Analysis and Inheritance (A) This pedigree represents a family affected by Huntington’s disease, which results from a rare dominant allele. Everyone who inherits this allele is affected. (B) The family in this pedigree carries the allele for albinism, a recessive trait. Because the trait is recessive, heterozygotes do not have the albino phenotype, but they can pass the allele on to their offspring. In this family, in generation III the heterozygous parents are cousins; however, the same result could occur if the parents were unrelated and both heterozygous. Q: Looking back at Figure 12.8, is red hair a recessive or a dominant trait? Simulation 12.1 Pedigree Analysis
- Every affected person has an affected parent; a dominant phenotype does not “skip generations” when looking back at ancestors.
- About half of the offspring with one affected parent are also affected. (This is easiest to observe among the 12 cousins in generation III.)
Compare this pattern with the one shown in Figure 12.9B, which is typical for the inheritance of a disease caused by a recessive allele:
- Affected people can have two parents who are not affected; a recessive disorder can skip generations when looking back at ancestors.
- Only a small proportion of people in the pedigree are affected: about one-fourth of children whose parents are both heterozygotes.
In the families of individuals who have a rare recessive phenotype, it is not uncommon to find a marriage of two relatives. This observation is a result of the rarity of recessive alleles that give rise to abnormal phenotypes. For two phenotypically normal parents to have a homozygous affected child (aa), the parents must both be heterozygous (Aa). If a particular recessive allele (a) is rare in the general population, the chance of two people mating to produce offspring who are both carrying that allele is quite low. However, if that allele is present in a family, two cousins might share it (see Figure 12.9B). For this reason, studies on populations that are isolated either culturally (by religion, as with the Amish in the United States) or geographically (as on islands) have been extremely valuable to human geneticists. People in these groups are more likely to marry relatives who may carry the same rare recessive alleles and to produce homozygous, affected offspring.
Recap and Assess
Mendel showed that genetic determinants are particulate and do not “blend” when the two gametes combine. Mendel’s first law of inheritance states that two copies of a gene segregate during gamete formation. His second law states that genes assort independently during gamete formation. The frequencies with which different allele combinations will be expressed in offspring can be calculated with a Punnett square or using probability theory.
- What results seen in the and generations of Mendel’s monohybrid cross experiments refuted the blending theory of inheritance?
- Diagram the processes of meiosis that underlie the laws of segregation and independent assortment.
- In guinea pigs, black body color (B) is completely dominant over albino (b). For the crosses in the table, give the genotypes of the parents:
| Parental phenotypes | Black offspring | Albino offspring | Parental genotypes? |
|---|---|---|---|
| Black albino | 12 | 0 | |
| Albino albino | 0 | 12 | |
| Black albino | 5 | 7 | |
| Black black | 9 | 3 |
- The pedigree below shows the inheritance of a rare mutant phenotype in humans, congenital cataracts (black symbols).
Generation
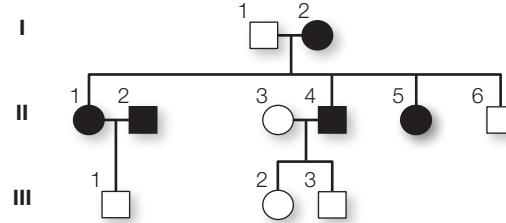
- Are congenital cataracts inherited as a dominant or recessive trait?
- Person #5 in the second generation mates with a man who does not have cataracts. Two of their four children, a boy and a girl, develop cataracts. What is the probability that their next child will be a girl with cataracts?
Mendel’s laws of inheritance remain valid today; his discoveries laid the groundwork for all future studies of genetics. Inevitably, however, we have learned that things are more complicated than they seemed at first. Let’s take a look at some of these complications, beginning with the interactions between alleles.
Alleles Can Produce Multiple Phenotypes
Learning Objectives
12.2.1 Recognize incomplete and codominance in a genetic cross.
12.2.2 Determine the possible blood types of an offspring when the blood types of the parents are known.
12.2.3 Define pleiotropy and give an example of an allele that is pleiotropic.
Over time genes accumulate changes, giving rise to new alleles. Thus there can be many alleles at a single gene that encode multiple traits for a single character. In addition, alleles do not always show simple dominant–recessive relationships. Furthermore, a single allele may have multiple phenotypic effects.
New alleles arise by mutation
Genes are subject to mutations, which are stable, inherited changes in the genetic material. In other words, an allele can mutate to become a different allele. For example, imagine that at one time all pea plants were tall, and that this trait was attributable to a height allele, T. At some point, a mutation occurred in T that resulted in a new allele, t, which causes short stature when homozygous. If this mutation were in a cell that underwent meiosis to form gametes, some of the resulting gametes would carry the t allele, and some offspring of this pea plant would carry the t allele. By creating variety, mutations provide the raw material for evolution.
Connect the Concepts Key Concept 14.1 describes a mutation as a change in the nucleotide sequence of DNA, and Key Concept 15.1 describes how various types of mutations affect phenotype in different ways.
Geneticists usually define one particular allele of a gene as the wild type; this allele is the one that is present in most individuals in nature (“the wild”) and gives rise to an expected trait or phenotype. Other alleles of that gene, often called mutant alleles, may produce a different phenotype. A gene that has a wild-type allele less than 99% of the time (the rest of the alleles being mutant) is said to be polymorphic (Greek poly, “many,” + morph, “form”).
Many genes have multiple alleles
Because of random mutations, more than two alleles of a given gene may exist in a group of individuals. Any one individual has only two alleles—one from its biological mother and one from its biological father. But among multiple individuals there may be several different alleles. In fact, there are many examples of such multiple alleles, and they often show a hierarchy of dominance. An example is coat color in rabbits, determined by four alleles of the C gene:
- C determines dark gray.
- chd determines chinchilla, a lighter gray.
- ch determines Himalayan, where pigment is restricted to the extremities (point restricted).
- c determines albino.
The hierarchy of dominance for these alleles is , . Any rabbit with the C allele (paired with itself or any other allele) is dark gray, and a cc rabbit is albino. Intermediate colors result from different allele combinations, as shown in Figure 12.10. As this example illustrates, multiple alleles can increase the number of possible phenotypes. At the biochemical level, these alleles determine various amounts of a pigment because of an enzyme with various levels of activity.
A dramatic and serious example of multiple alleles involves the gene product targeted by certain widely used drugs designed to undermine the effects of the parasite that causes malaria in humans. There are numerous alleles of this parasite gene, some of which make the gene product insensitive to the drugs (they cannot bind to the target protein). Since the parasite is haploid, when a parasite has one of these resistance alleles and is in a human who is being treated with the drugs, that parasite will survive and reproduce while the vast majority of parasites with drug-sensitive wild-type alleles will be killed. Drug-resistant malaria causes great human suffering. The World Health Organization estimates that there are about 200 million new cases of malaria every year, more than half a million of them fatal.
Dominance is not always complete
In the pairs of alleles studied by Mendel, dominance is complete in heterozygous individuals. That is, an Rr individual always expresses the R phenotype. However, many genes have alleles that are not dominant or recessive to one another. Instead, the heterozygotes show an intermediate phenotype—at first glance, that appeared to support the old blending theory of inheritance. For example, if a true-breeding eggplant that produces the familiar purple fruit is crossed with a true-breeding white eggplant, all the plants produce violet fruit, an intermediate between the two parents. However, further crosses indicate that this apparent blending phenomenon can still be explained in terms of Mendelian genetics (Figure 12.11). The purple and white alleles have not disappeared, as those colors reappear when the plants are interbred.
When heterozygotes show a phenotype that is intermediate between those of the two homozygotes, the gene is said to be governed by incomplete dominance. In other words, neither of the two alleles is dominant over the other.
In codominance, both alleles at a gene are expressed
Sometimes the two alleles at a gene produce two different phenotypes that both appear in heterozygotes, a phenomenon called codominance. Note that this is different from incomplete dominance, where the phenotype of a heterozygote is an intermediate between the phenotypes of the parents. A good example of codominance is seen in the ABO blood group system in humans (this is also an example of multiple alleles and of complete dominance).
Early attempts at blood transfusion frequently killed the parent. Around 1900, the Austrian scientist Karl Landsteiner mixed blood cells and serum (blood from which cells have been removed) from different individuals. He found that only certain combinations of blood and serum are compatible. In other combinations, the red blood cells from one individual form clumps in the presence of serum from the other individual, a discovery that led to our ability to administer compatible blood transfusions that do not kill the recipient.
Clumps in mixed blood form as a consequence of mechanisms of the immune system that protect the body from invasion by “nonself” molecules or organisms. Specific proteins in human serum, called antibodies, react with foreign molecules or particles. The specific part of a molecule that is recognized by an antibody is called an antigen. Oligosaccharides on the surfaces of red blood cells can function as antigens. For example, people with type A blood make the A antigen but not the anti-A antibody, and those in the B group make the B antigen but not the anti-B antibody; A and B antigens are specific oligosaccharides on the surfaces of their red blood cells. If a person with type A blood is given a transfusion of type B or type AB blood, that individual’s immune system will recognize the B antigen as nonself and its anti-B antibodies will react against it (Figure 12.12). Likewise, a person with type B blood has anti-A antibodies that will react with blood from an individual with the A antigen (type A or AB). However, someone with the codominant AB blood type makes both the A and the B antigens and does not make antibodies against either antigen. So a person with type AB blood can receive a transfusion from any of the blood groups. Individuals with type O blood make neither the A nor the B antigen and thus make anti-A and anti-B antibodies; as a result, they can receive blood only from a type O individual but can donate blood to individuals of any ABO blood group.
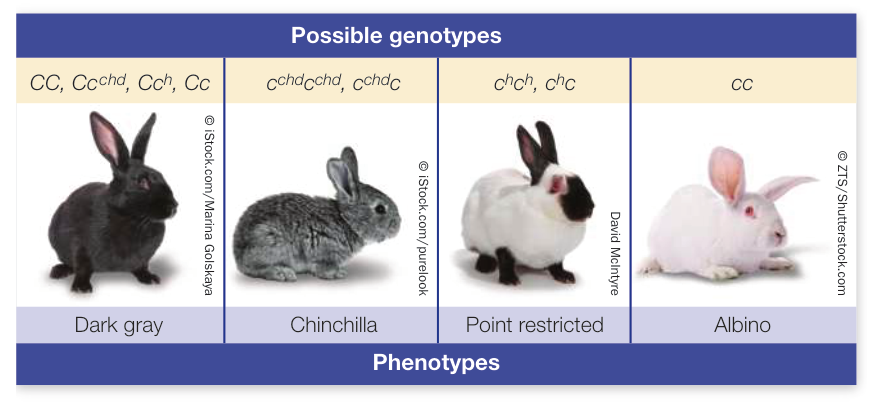
Figure 12.10 Multiple Alleles for Coat Color in Rabbits These photographs show the phenotypes conferred by four alleles of the C gene for coat color in rabbits. Different combinations of two alleles give different coat colors and pigment distributions.
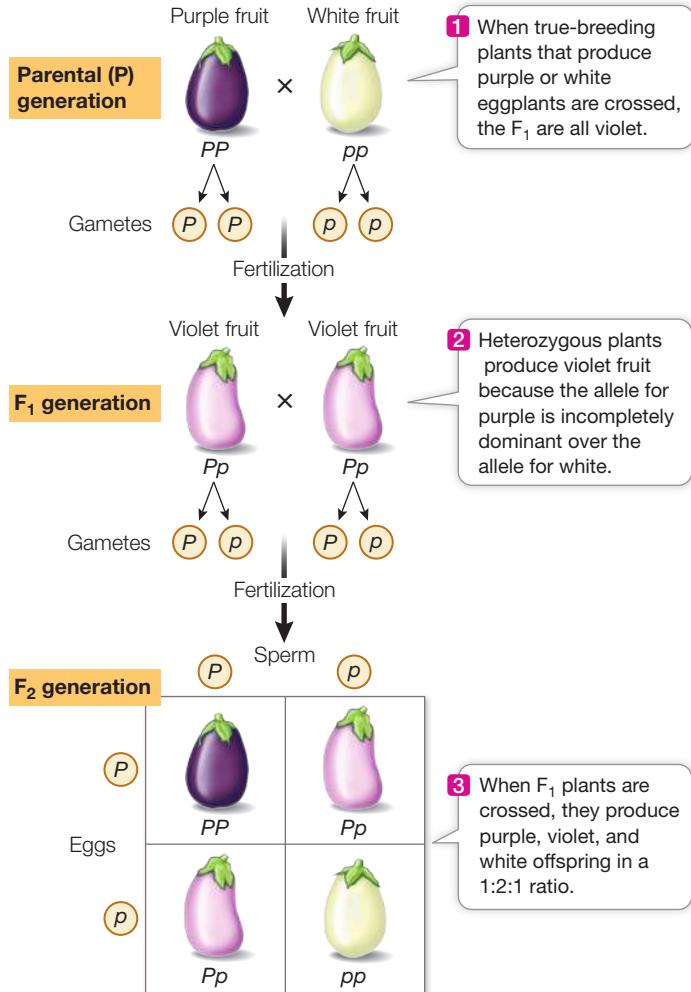
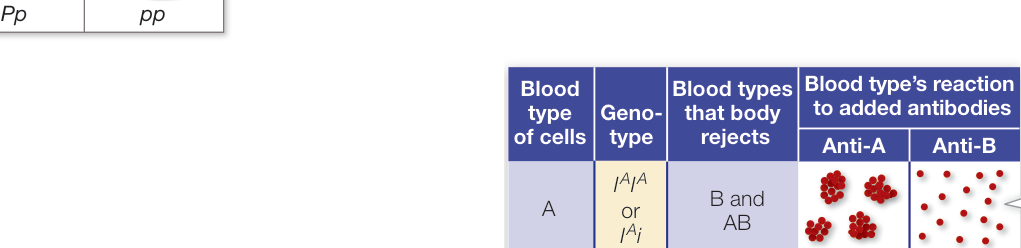
Figure 12.11 Incomplete Dominance Follows Mendel’s Laws An intermediate phenotype can occur in heterozygotes when neither allele is dominant. The heterozygous phenotype (here, violet fruit) may give the appearance of a blended trait, but the traits of the parental generation reappear in their original forms in succeeding generations, as predicted by Mendel’s laws of inheritance.
The oligosaccharides on the surfaces of red blood cells are made by enzymes that catalyze the formation of bonds between specific sugars. The ABO gene encodes one such enzyme and has three alleles, , , and , each producing a different version of the enzyme. The product of the allele adds -acetylgalactosamine to the end of a preexisting oligosaccharide chain, resulting in the A antigen. The product of the allele adds galactose to the same chain, making the B antigen. The allele is fully recessive to the other two alleles and encodes a protein that has no enzymatic activity. The and alleles are codominant because a person with both alleles makes both the A and the B antigens, and both kinds of oligosaccharides occur on their red blood cells. You’ll learn more about the functions of antibodies and antigens in Chapter 40.
Some alleles have multiple phenotypic effects
Mendel’s principles were further extended when it was discovered that a single allele can influence more than one phenotype. In such a case, we say that the allele is pleiotropic. An example is the heritable human disease phenylketonuria, or PKU, which causes mental retardation and reduced hair and skin pigmentation. The disease occurs in people who have a mutation in the gene for a liver enzyme that converts the amino acid phenylalanine to tyrosine. Without a functional form of this enzyme, phenylalanine builds up in the body to toxic levels, and this affects development in a variety of ways. Given what we now know about genes and their functions, it is not surprising that a gene with such an important metabolic role should have pleiotropic effects. Other examples of pleiotropy include plant and animal genes whose products affect hormone levels, since many hormones play multiple roles in the body.
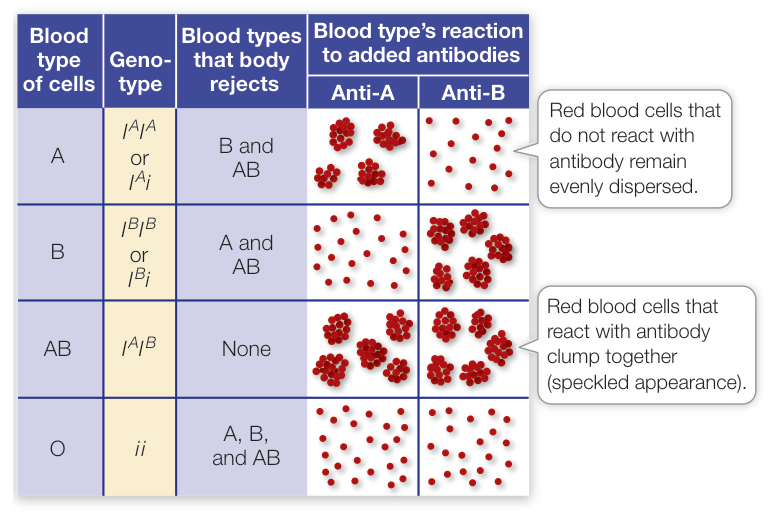
Figure 12.12 ABO Blood Reactions Are Important in Transfusions This table shows the results of mixing red blood cells of types A, B, AB, and O with serum containing anti-A or anti-B antibodies. As you look down the columns, note that each type, when mixed separately with anti-A and with anti-B, gives a unique pair of results; this is the basic method by which blood is typed. People with type O blood are the universal blood donors. People with type AB blood are good recipients, since they make neither type of antibody. When blood transfusions are incompatible, the reaction (clumping of red blood cells) can have severely adverse consequences for the recipient.
Recap and Assess
Genes are subject to random mutations that give rise to new alleles; thus many genes have more than two alleles within a population. Dominance is not necessarily an all-or-nothing phenomenon. Some genes have multiple effects on phenotype.
- What is the difference between codominance and incomplete dominance?
- A woman has blood type O and her biological mother has blood type B. What is the genotype of the mother? What are the possible blood types of the biological father?
- In a particular plant species, two alleles control flower color, which can be yellow, green, or blue. Crosses of these plants produce the following offspring:
| Parental phenotypes | Offspring phenotypes |
|---|---|
| Yellow yellow | All yellow |
| Green yellow | green and yellow |
| Green blue | blue and green |
| Blue blue | All blue |
What will be the phenotypes, and ratio, of the offspring of a cross of green green?
Thus far we have discussed phenotypic characters that are affected by single genes. In many cases, however, several genes interact to determine a phenotype. To complicate things further, the physical environment may influence which genes of an individual are expressed, meaning that phenotype is sometimes determined by both genes and the environment.
Genes Can Interact to Produce a Phenotype
Learning Objectives
- 12.3.1 Predict the phenotypes obtained in a cross involving two genes that show epistasis.
- 12.3.2 Determine from genotype and phenotype data whether a trait exhibits incomplete penetrance or variable expressivity.
- 12.3.3 Describe the difference between quantitative and qualitative (discrete) variation.
You have just seen how two alleles of the same gene can interact to produce a phenotype. Some phenotypes, such as human height, are influenced by the products of many genes, not just alleles of the same gene. We now turn to the genetics of such gene interactions.
Epistasis (“to stand on”) occurs when the phenotypic expression of one gene is affected by another gene. For example, two genes (B and E) encode proteins that determine coat color in Labrador retrievers:
- Allele B (black pigment) is dominant over b (brown, or chocolate).
- Allele E (pigment deposition in hair) is dominant over e (no deposition, so hair is yellow).
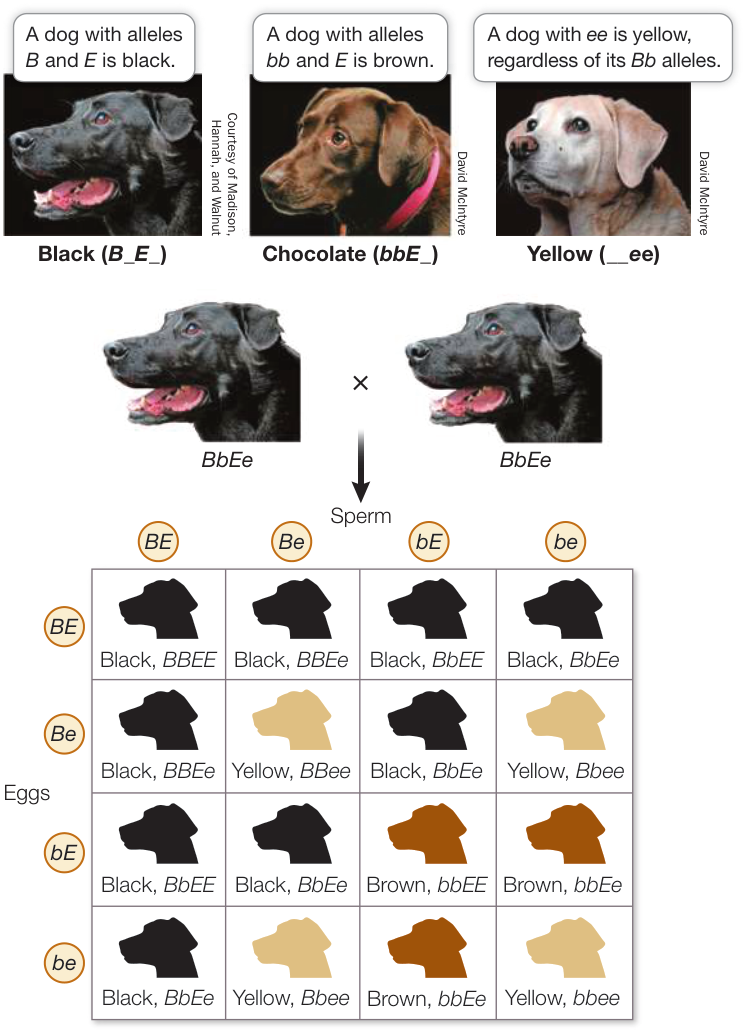
Figure 12.13 Genes May Interact Epistatically Epistasis occurs when one gene alters the phenotypic effect of another gene. In Labrador retrievers, the E gene controls whether or not pigment, determined by the B gene, is deposited into the coat. Q: A mating of yellow and brown retrievers produced a black pup. What were the possible genotypes of the parents?
An EE or Ee dog with BB or Bb is black, and one with bb is brown. An ee dog is yellow regardless of the B gene alleles present (Figure 12.13). Because the product of the E allele is needed for the expression of both the B and the b alleles, E is said to be epistatic to B.
Hybrid vigor results from new gene combinations and interactions
In 1876, Charles Darwin reported that when he crossed two different true-breeding, homozygous genetic strains of corn, the offspring were 25% taller than either of the parent strains. Darwin’s observation was largely ignored for the next 30 years. In 1908, George Shull “rediscovered” this idea, reporting that not just plant height but the weight of the corn grain produced was dramatically higher in the offspring (Figure 12.14). Agricultural scientists took note, and Shull’s paper had a lasting impact on the field of applied genetics. The cultivation of hybrid corn spread rapidly in the United States and all over the world, quadrupling grain production. The practice of hybridization has spread to many other crops and animals used in agriculture. For example, beef cattle that are crossbred are larger and live longer than cattle bred within their own genetic strain.
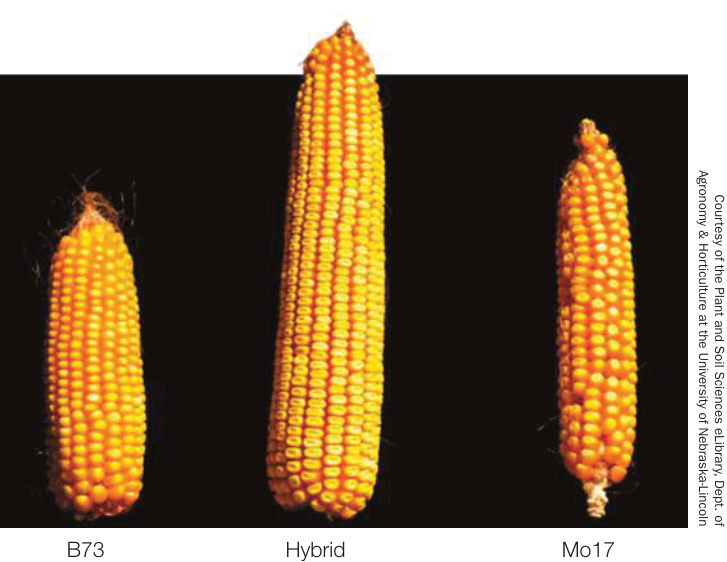
Figure 12.14 Hybrid Vigor in Corn Two parent lines of corn, B73 and Mo17, that are homozygous at most genes were crossed to produce the more vigorous hybrid line that is heterozygous at most genes.
Farmers have known for centuries that matings among close relatives (known as inbreeding) can result in inbreeding depression: reduced biological fitness arising from mating close relatives that tend to have the same recessive, sometimes deleterious, alleles. Inbreeding can produce offspring of smaller size and/or lower quality than matings between unrelated individuals. In contrast, superior qualities can arise from crossing inbred lines, a phenomenon called hybrid vigor, or heterosis (short for heterozygosis).
The mechanism by which heterosis arises is not known but is important to understand, given how agriculture relies on heterosis for improving food production. Two competing hypotheses have been proposed. The dominance hypothesis explains the extra growth in hybrids as an absence of inbreeding depression—by the assumption that hybrids are unlikely to be homozygous for deleterious recessive alleles. The overdominance hypothesis postulates that in hybrids, new combinations of alleles from the parental strains interact with one another, resulting in superior traits that did not occur in the parental lines. Recent studies suggest that both dominance and overdominance contribute to heterosis in specific characters.
The environment affects gene action
The phenotype of an individual does not result from its genotype alone. Genotype and environment interact to determine the phenotype of an organism. This is especially important to remember in the era of genome sequencing (covered in Chapter 17). When the sequence of the human genome was completed in 2003, it was hailed as the “book of life,” and public expectations of the benefits gained from this knowledge were (and are) high. But this kind of “genetic determinism” is wrong. You already know that environmental variables such as light, temperature, and nutrition can affect the phenotypic expression of a genotype.
A familiar example of this phenomenon involves “point restriction” coat patterns found in Siamese cats and certain rabbit breeds (Figure 12.15). These animals carry a mutant allele of a gene that controls the growth of dark fur all over the body. As a result of this mutation, the enzyme encoded by the gene is inactive at temperatures above a certain point (usually around 35°C). The animals maintain a body temperature above this point, and so their fur is mostly light. However, the extremities—feet, ears, nose, and tail—are cooler, about 25°C, so the fur on these regions is dark. These animals are all white when they are born, because the extremities were kept warm in the mother’s womb.
A simple experiment shows that the dark fur is temperature-dependent. If a patch of white fur on a point-restricted rabbit’s back is shaved off and an ice pack is placed on the skin where the patch was, the fur that grows back will be dark. This indicates that although the gene for dark fur was expressed all along, the environment inhibited the activity of the mutant enzyme.
Two parameters describe the effects of genes and environment on the phenotype:
- Penetrance is the proportion of individuals in a group with a given genotype that actually show the expected phenotype. For example, many people who inherit a mutant allele of the gene BRCA1 develop breast cancer. But some people with the mutation do not. So the BRCA1 allele is said to be incompletely penetrant.
- Expressivity is the degree to which a genotype is expressed in an individual. For example, a woman with the mutant BRCA1 allele may develop both breast and ovarian cancer as part of the phenotype, but another woman with the same mutation may develop only breast cancer. So the mutant allele is said to have variable expressivity.
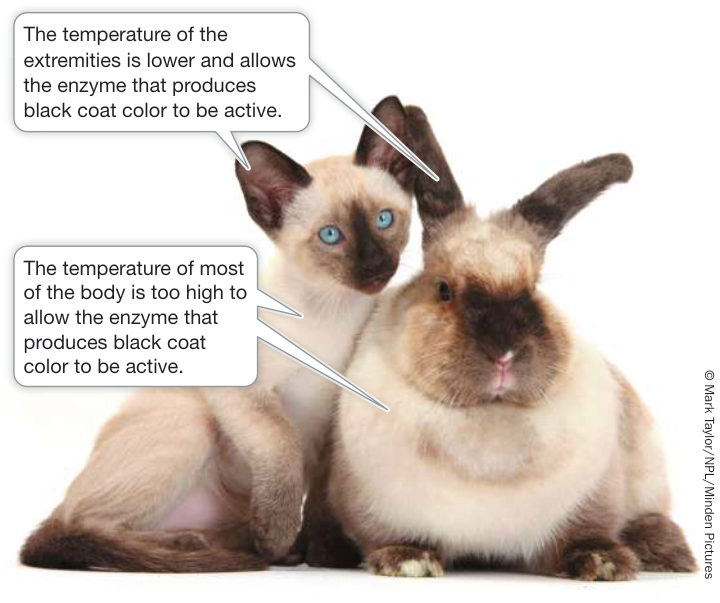
Figure 12.15 The Environment Influences Gene Expression This rabbit and cat express a coat pattern called “point restriction.” Their genotypes specify dark fur, but the enzyme for dark color is inactive at normal body temperature, so only the extremities—the coolest regions of the body—express the dark fur phenotype.
Most complex phenotypes are determined by multiple genes and the environment
Certain simple characters, such as those that Mendel studied in peas, differ in discrete, qualitative ways, such as purple or white flowers, or round or wrinkled seeds. But many characters are complex, such as height in humans, with phenotypes that vary more or less continuously over a range. Some people are short, others are tall, and many are in between the two extremes. Such variation within a population is called quantitative, or continuous, variation (Figure 12.16).
In some cases the variation in quantitative characters results primarily from variation in genotypes across individuals within the population. For instance, much of human eye color is the result of several genes controlling the synthesis and distribution of dark melanin pigment. Dark eyes have a lot of it, brown eyes less, and green, gray, and blue eyes even less. In the latter cases, the distribution of other pigments in the eye is what determines light reflection and color.
In many cases, however, quantitative variation is due to both genes and environment. Height in humans certainly falls into this category. If you look at families, you often see that parents and their offspring all tend to be tall or short. However, nutrition also plays a role in height: American 18-year-olds today are about 6% taller than their great-grandparents were at the same age. Three generations are not enough time for mutations that would exert such a dramatic effect to spread throughout the general population, so the height difference must be due to environmental factors.
Geneticists call the chromosomal regions that together determine such complex characters quantitative trait loci. A locus (plural loci) is a specific position on a chromosome. A locus on a chromosome may be large or small (as small as a single base pair). A quantitative trait locus can contain one or several genes. Identifying quantitative trait loci is a major challenge, and an important one. For example, the amount of grain that a variety of rice produces in a growing season is determined by many interacting quantitative trait loci. Crop plant breeders have worked hard to identify these loci and the genes they contain in order to breed higher-yielding rice strains. In a similar way, human characteristics such as disease susceptibility and behavior are caused in part by quantitative trait loci. Some traits turn out to be affected by many loci in the genome. For example, there are about a thousand loci that contribute to the variation in human height, most of which have very small effect, usually less than a millimeter.
Recap and Assess
In epistasis, one gene affects the expression of another. Perhaps the most challenging problem for genetics is identifying the genes contributing to phenotypic variation for complex traits that are caused by many interacting genes and the environment.
- An individual with three copies of chromosome 21 always has Down syndrome. However, some individuals are more severely affected than others. Does Down syndrome show incomplete penetrance? Variable expressivity?
- In general, height is considered to be a quantitative trait. However, in Mendel’s pea plants height is considered to be a qualitative trait. Explain why.
- If the dominant allele A is necessary for hearing in humans, and another allele, B, located on a different chromosome, results in deafness no matter what other genes are present, what percentage of the offspring of a parental cross of aaBb × Aabb will be deaf?
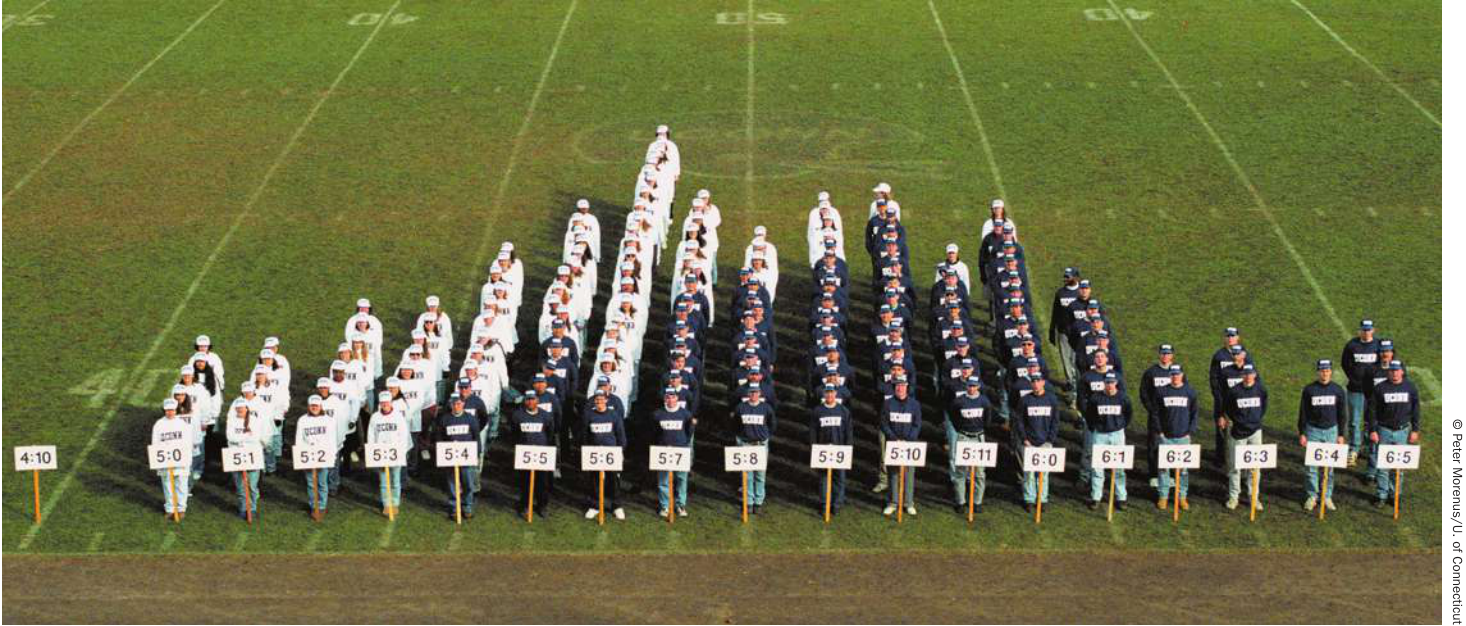
Figure 12.16 Quantitative Variation Quantitative variation is produced by the interaction of genes at multiple loci and the environment. These students (women [in white] are shorter; men [in blue] are taller) show continuous variation in height that is the result of interactions between many genes and the environment.
In the next key concept we’ll see how the discovery that genes occupy specific positions on chromosomes enabled scientists who followed Mendel to provide a physical explanation for his model of inheritance, and to provide an explanation for those cases where Mendel’s second law does not apply.
Genes Are Carried on Chromosomes
Learning Objectives
- 12.4.1 Describe evidence that two genes are genetically linked on the same chromosome.
- 12.4.2 Calculate the map distance between two genes using data from a test cross.
- 12.4.3 Predict the frequency of affected and unaffected offspring from a cross involving a sex-linked gene.
There are far more genes than chromosomes. Studies of different genes that are physically linked on the same chromosome reveal inheritance patterns that are not Mendelian. These patterns have been useful for identifying genes that are linked to one another, and for determining how far apart they are on the chromosome.
Soon after Mendel was rediscovered, dihybrid crosses that did not show 9:3:3:1 Mendelian ratios were discovered. Demonstrating that such violations of Mendel’s law of independent assortment were caused by genetic linkage on chromosomes was first figured out in the fruit fly Drosophila melanogaster. Its small size, the ease with which it can be bred, its few chromosomes, and its short generation time make this animal an attractive experimental subject. Beginning in 1909, Thomas Hunt Morgan and his students at Columbia University pioneered the study of Drosophila, and today it remains an important model organism for studies of genetics.
Linked genes are inherited together
Some of the crosses Morgan performed with fruit flies yielded phenotypic ratios that were not in accordance with those predicted by Mendel’s law of independent assortment. Morgan crossed Drosophila with known genotypes at two genes, B and Vg:
- B (wild-type gray body) is dominant over b (black body).
- Vg (wild-type wing) is dominant over vg (vestigial, a very small wing).
Morgan first showed that both of these genes followed Mendel’s law of segregation. Then he performed a dihybrid cross, making an generation by crossing homozygous dominant BBVgVg flies with homozygous recessives (bbvgvg). He then test-crossed the flies: BbVgvg bbvgvg. Morgan expected to see four phenotypes in a ratio of 1:1:1:1, but that is not what he observed. The body-color gene and the wing-size gene were not assorting independently; rather, particular alleles at these two genes were usually inherited together (Figure 12.17).
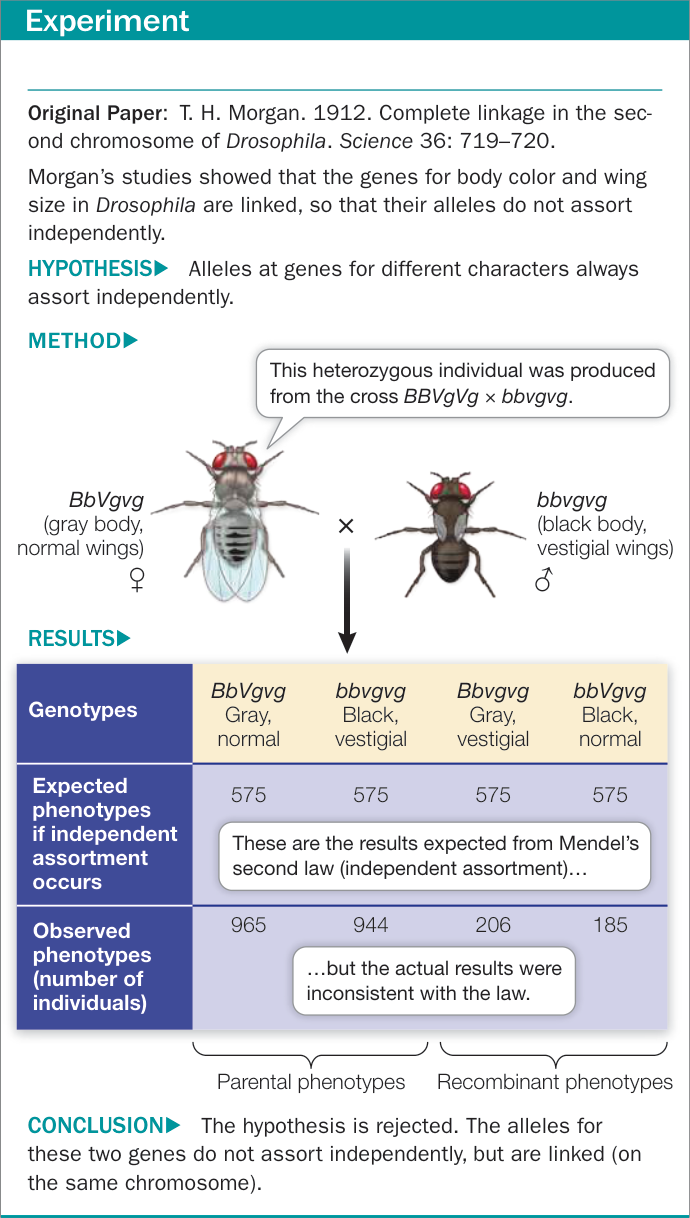
Figure 12.17A Some Alleles Do Not Assort Independently
Morgan knew about chromosomes and meiosis. To explain the data, he proposed that the two Drosophila genes are on the same chromosome—that is, that they are physically linked. Suppose that the B and Vg genes are indeed located on the same chromosome. In that case, the flies would have one homolog containing the B and Vg alleles (from their homozygous BBVgVg parent) and the other homolog containing the b and vg alleles (from their homozygous bbvgvg parent). Why didn’t all of Morgan’s flies have the phenotypes that would result from them receiving either a BVg or a bvg gamete from the double heterozygous parent—that is, why didn’t his cross result in gray flies with normal wings and black flies with vestigial wings, in a 1:1 ratio? If linkage were absolute—that is, if chromosomes always remained intact and unchanged—we would expect to see just those two types of progeny, resulting from the same two parental gametes that fused to create the parent. However, this does not always happen.
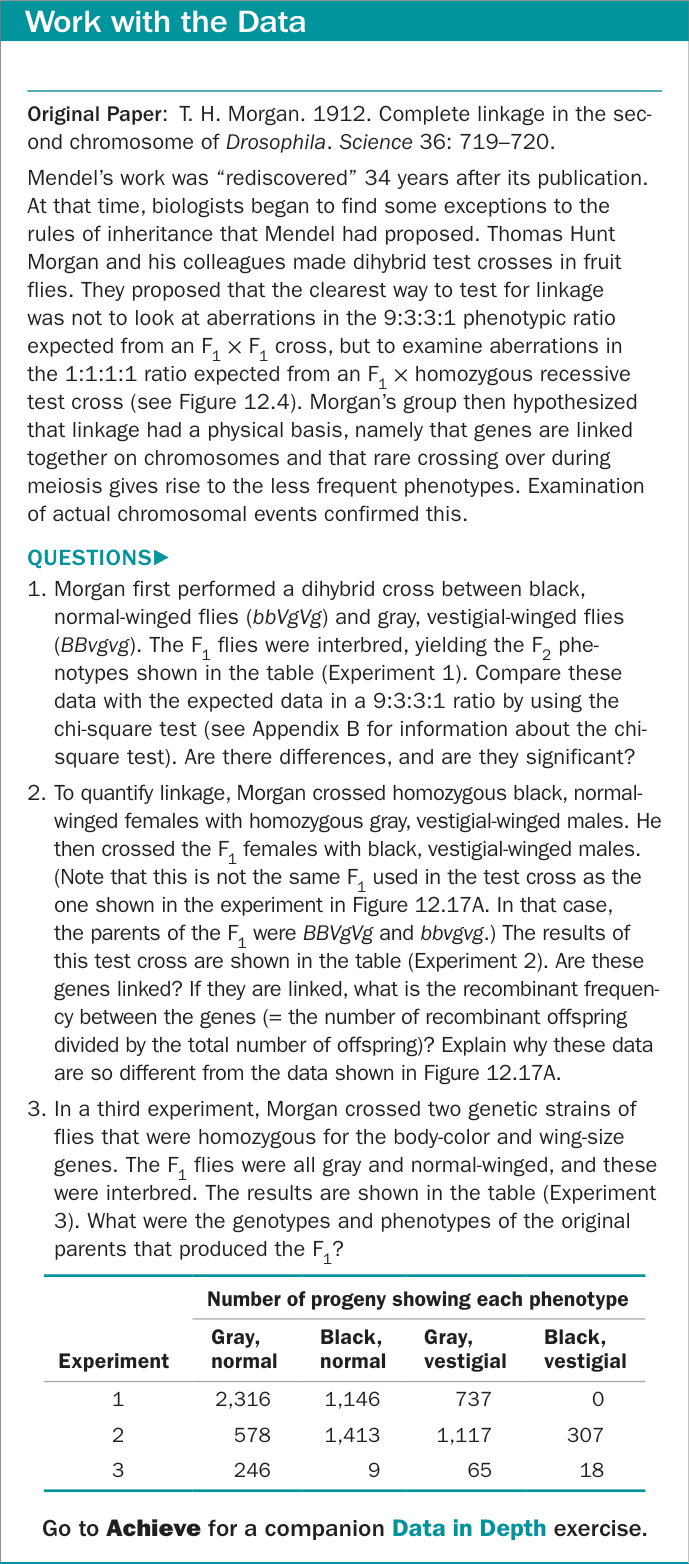
Figure 12.17B Some Alleles Do Not Assort Independently Figure 12.17B Some Alleles Do Not Assort Independently
Genes can be exchanged between chromatids and mapped
If physical linkage of genes meant that genetic linkage was absolute, then only parental-type gametes would be produced and Mendel’s law of independent assortment would apply only to genes on different chromosomes. Instead, alleles at different genes that are on the same chromosome do sometimes separate from one another during meiosis, resulting in recombinant gametes—gametes that differ from the parental-type gametes in terms of the alleles that they carry. Genes on the same chromosome may recombine to produce recombinant gametes when two homologous chromosomes physically exchange corresponding segments during prophase I of meiosis—that is, by crossing over (Figure 12.18). As discussed in Key Concept 11.2, DNA is replicated during S phase, so that by prophase I, when homologous chromosome pairs come together, each chromosome consists of two sister chromatids.
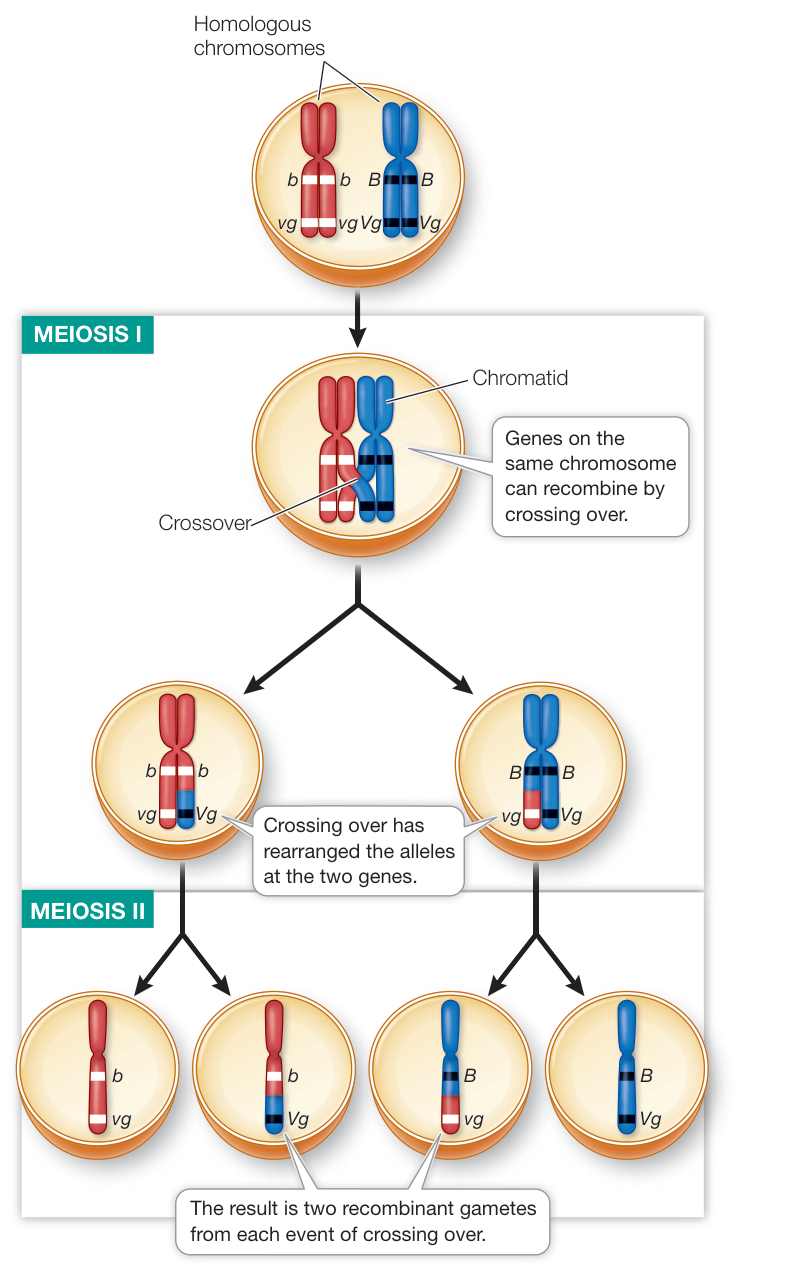
Figure 12.18 Crossing Over Results in Genetic Recombination Recombination accounts for why linked alleles are not always inherited together. Genes on the same chromosome can be recombined by crossing over, and linked alleles separated from one another. Such recombination occurs during prophase I of meiosis.
Note that one exchange event involves only two nonsister chromatids, one from each member of the homologous pair, and can occur at any point along the length of the chromosome. The chromosome segments involved are exchanged reciprocally, so both chromatids involved in crossing over become recombinant (that is, each chromatid ends up with alleles from both of the organism’s parents). Several exchange events can occur along the length of each homologous pair.
When crossing over takes place between two linked genes, not all the gametes will be parental types. Instead, recombinant gametes will appear as well, as they did in Morgan’s test cross, producing recombinant offspring (see Figure 12.17). The frequency with which recombinant offspring are produced is called the recombinant frequency, which is calculated by dividing the number of recombinant offspring by the total number of offspring (Figure 12.19). Recombinant frequencies will be greater for genes that are farther apart on the chromosome than for genes that are closer together because an exchange event is more likely to occur between genes that are far apart. However, because of multiple crossovers, the recombinant frequency between two genes will never exceed 50%.
By calculating recombinant frequencies, geneticists can infer the locations of genes along a chromosome and generate a genetic map. Figure 12.20 shows a map of five genes on a fruit fly chromosome constructed using the recombination frequencies generated by test crosses involving various pairs of genes. The recombination frequencies obtained in crosses involving two genes are converted to map units (also called centimorgans, cM); one map unit is equivalent to an average recombination frequency of 0.01 (1%). In the chromosome shown in Figure 12.20, the recombination frequency between the yellow body gene (y) and the white eye gene (w) is low, so they are close together on the map (1 map unit apart). Recombination between the yellow body gene (y) and the vermillion eye gene (v) is more frequent, so they are farther apart (31 map units).
Gene sequencing of DNA has allowed the relationship between genetic distance, in map units, and physical distance, in base pairs, to be determined. This relationship varies across regions of chromosomes and across organisms (in flies, 1 map unit is about 200–500,000 base pairs of DNA). While DNA sequencing has made genetic mapping of chromosomes using crosses less important in some areas of genetics research, it is still a way to verify that a particular DNA sequence corresponds with a particular phenotype. Linkage has allowed biologists to isolate genes and to identify genetic markers (a sequence of DNA that is easily scored) linked to important genes. This is important in breeding new crops and animals for agriculture, and for identifying people carrying medically significant mutations.
Connect the Concepts As described in Key Concept 17.1, gene sequencing techniques reveal the nucleotide sequences of genes and identify where genes begin and end on the chromosome.
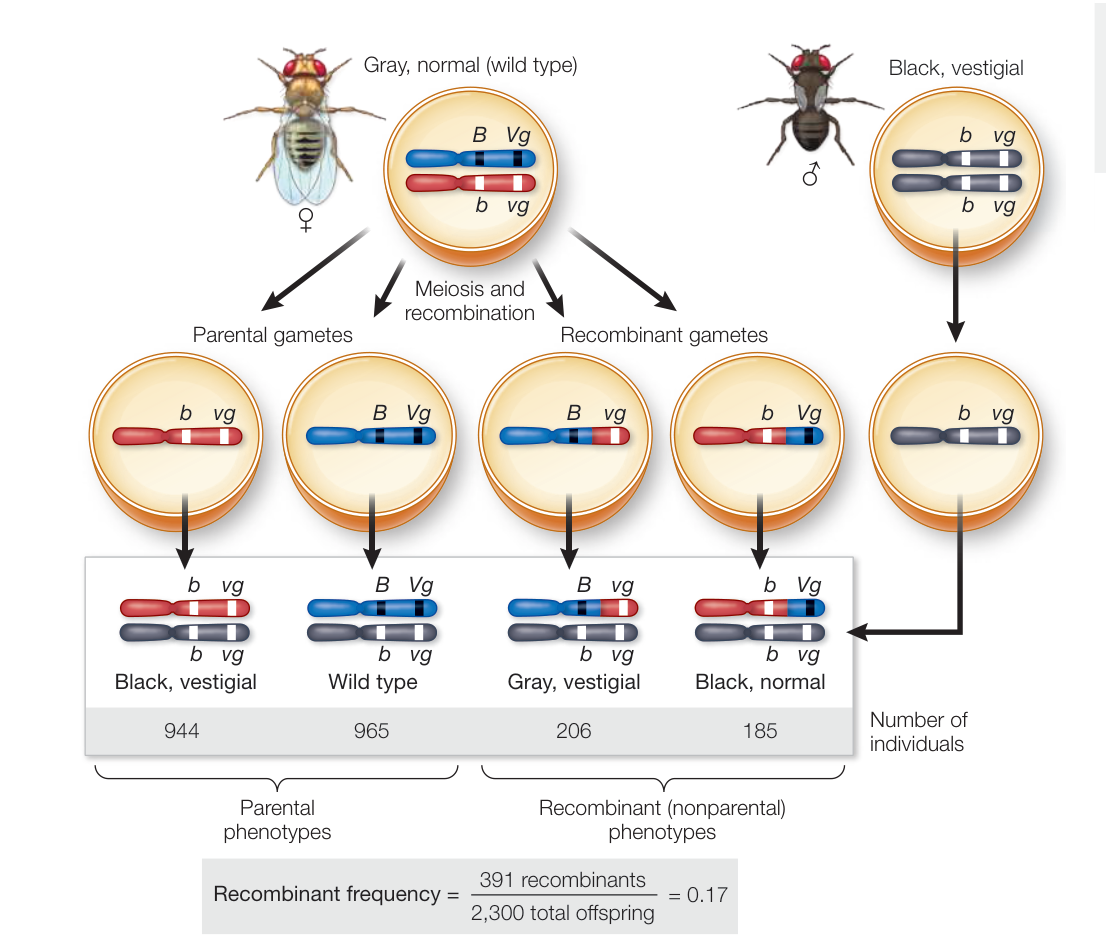
Figure 12.19 Recombinant Frequencies The frequency of recombinant offspring, which are those produced by recombinant (nonparental) gametes, can be calculated.
Sex linkage is revealed by studies of characters showing differences in reciprocal crosses
In his work, Mendel performed reciprocal crosses—for each cross he would use one parent as the pollen donor (male parent) and one as the pollen recipient (female parent) and vice-versa. Reciprocal crosses always gave similar results; it did not matter which individual was acting as the male, implying that traits are inherited identically through sperm and eggs. However, in species with separate sexes, reciprocal crosses sometimes give different results. For example, in humans a color-blind biological mother and a normal biological father always have color-blind sons and normal daughters, while a color-blind biological father and a normal biological mother have normal sons and daughters. To understand the types of inheritance in which reciprocal crosses give different results, we must consider the ways in which sex is determined in different species.
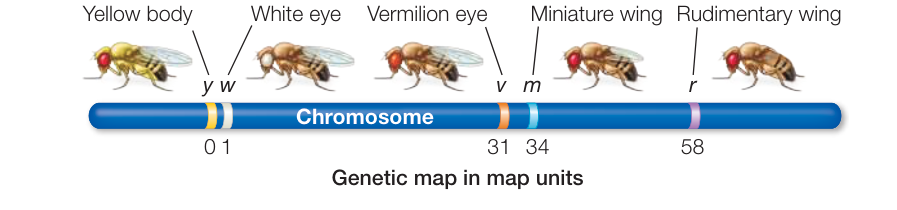
Figure 12.20 The Genetic Map of a Chromosome in Drosophila Showing the Positions of Five Genes The map distances between adjacent pairs of genes, obtained from genetic crosses, are used to generate a linear map (in map units) of the chromosome.
SEX DETERMINATION BY CHROMOSOMES In corn, every diploid adult has both male and female reproductive structures. The tissues in these two types of structures are genetically identical, just as roots and leaves are genetically identical. Organisms such as corn, in which the same individual produces both male and female gametes, are said to be monoecious (Greek, “one house”). Other organisms, such as date palms and most animals, are dioecious (“two houses”), meaning that some individuals can produce only male gametes and others can produce only female gametes. In other words, in dioecious organisms the different sexes are different individuals.
In mammals and birds, sex is determined by differences in the chromosomes, but such determination operates in different ways in different groups of organisms. For example, in many animals, including mammals, sex is determined by a single pair of sex chromosomes, which are chromosomes that differ in copy number between males and females. The remaining chromosomes, called autosomes, occur in pairs in males and females. For example, in humans there are 22 pairs of autosomes in males and females, and 1 pair of sex chromosomes. The chromosomal bases for sex determination in various groups of animals are summarized in Table 12.2.
The sex chromosomes of female mammals consist of a pair of X chromosomes. Male mammals, by contrast, have one X chromosome and a sex chromosome that is not found in females, the Y chromosome. Females may be represented as XX (homogametic) and males as XY (heterogametic).
MALE MAMMALS PRODUCE TWO KINDS OF GAMETES Each gamete produced by a male mammal has a complete set of autosomes, but just as each gamete carries one copy of each pair of autosomes, each carries one sex chromosome; half carry an X and the other half carry a Y. When an X-bearing sperm fertilizes an egg, the resulting XX zygote is female; when a Y-bearing sperm fertilizes an egg, the resulting XY zygote is male.
Table 12.2 Sex Determination in Animals
| Animal group | Mechanism |
|---|---|
| Bees | Males are haploid, females are diploid |
| Birds and butterflies | Males ZZ (homogametic), females ZW (heterogametic) |
| Mammals and flies | Males XY (heterogametic), females XX (homogametic) |
SEX CHROMOSOME ABNORMALITIES REVEALED THE GENE THAT DETERMINES SEX Can we determine which chromosome, X or Y, carries the sex-determining gene, and can the gene be identified? One way to determine cause (e.g., the presence of a gene on the Y chromosome) and effect (e.g., maleness) is to look at cases of biological error, in which the expected outcome does not happen.
We can learn something about the functions of X and Y chromosomes from abnormal sex chromosome arrangements resulting from nondisjunction during meiosis or mitosis (see Key Concept 11.5). As you will recall, nondisjunction occurs when a pair of homologous chromosomes (in meiosis I) or sister chromatids (in mitosis or meiosis II) fails to separate. As a result, a gamete may have one too few or one too many chromosomes. If this gamete fuses with another gamete that has the full haploid chromosome set, the resulting offspring will be aneuploid, with fewer or more chromosomes than normal.
In humans, XO individuals sometimes appear. The O indicates that a chromosome is missing—that is, individuals who are XO have only one sex chromosome (an X). Human XO individuals are females who are moderately abnormal physically but normal mentally; usually they are also sterile. The XO condition in humans is called Turner syndrome. It is the only known case in which a person can survive with only one member of a chromosome pair (here, the XY pair), although most XO conceptions are spontaneously terminated early in development. XXY individuals also occur; this condition, which affects males, is called Klinefelter syndrome and results in overlong limbs and sterility.
These observations suggested that the gene controlling maleness is located on the Y chromosome. Observations of people with other types of chromosomal abnormalities helped researchers pinpoint the location of that gene:
- Some women are genetically XY but lack a small portion of the Y chromosome.
- Some men are genetically XX but have a small piece of the Y chromosome attached to another chromosome.
The Y fragments that are respectively missing and present in these two cases are the same and contain the maleness-determining gene, which was named SRY (sex-determining region on the Y chromosome).
The SRY gene encodes a protein involved in primary sex determination—that is, the determination of the kinds of gametes that an individual will produce and the organs that will make them (the male and female gonads). In the presence of the functional SRY protein, an embryo develops sperm-producing testes. If the embryo has no Y chromosome, the SRY gene is absent, and thus the SRY protein is not made. In the absence of the SRY protein, the embryo develops egg-producing ovaries. In this case, a gene on the X chromosome called DAX1 produces an anti-testis factor. So the role of SRY in a male is to inhibit the maleness inhibitor encoded by DAX1. The SRY protein does this in male cells, but since it is not present in females, DAX1 can act to inhibit maleness.
One function of the gonads is to produce hormones (such as testosterone and estrogen) that send signals to the rest of the body and control the development of secondary sex characteristics.
These are outward manifestations of maleness and femaleness, such as differences in body type, breast development, body hair, and voice. Secondary sex characteristics distinguish males and females but are not directly part of the reproductive system.
SEX-LINKED INHERITANCE IN FRUIT FLIES Like humans, fruit flies have an XY sex determination system, with males having one X and one Y, and females having two X chromosomes. However, in flies an XO individual is a male, not a female as in humans, and an XXY individual is a female, not a male as in humans. This indicates that in fruit flies it is the number of X chromosomes, not the presence of a Y chromosome, that determines sex. As in other organisms, the X and Y chromosomes are not complete homologs of one another: many genes on the X chromosome are not present on the Y. The X chromosome of Drosophila was one of the first to have specific genes assigned to it.
Thomas Morgan identified a sex-linked gene that controls eye color in Drosophila. The wild-type allele of the gene confers red eyes, whereas a recessive mutant allele confers white eyes. Morgan’s experimental crosses demonstrated that this eye-color gene is on the X chromosome. If we abbreviate the eye-color alleles as R (red eyes) and r (white eyes), the presence of the alleles on the X chromosome is designated by and .
Morgan crossed a homozygous red-eyed female () with a white-eyed male. The male is designated because the Y chromosome does not carry this gene. (Any gene that is present as a single copy in a diploid organism is called hemizygous.) All the sons and daughters from this cross had red eyes, because the red phenotype is dominant over white and all the progeny had inherited a wild-type X chromosome () from their mother (Figure 12.21A). This phenotypic outcome would have occurred even if the R gene had been present on an autosome rather than a sex chromosome. In that case, the male would have been homozygous recessive—rr.
When Morgan performed the reciprocal cross, in which a white-eyed female () was mated with a red-eyed male (), the results were unexpected: instead of all offspring being heterozygous with red eyes, all the sons were white-eyed and all the daughters were red-eyed (Figure 12.21B). The sons from the reciprocal cross inherited their only X chromosome from their white-eyed mother and were therefore hemizygous for the white allele. The daughters, however, got an X chromosome bearing the r allele from their mother and an X chromosome bearing the R allele from their father; therefore they were red-eyed heterozygotes. When these heterozygous females were mated with red-eyed males, half their sons had white eyes but all their daughters had red eyes. Together, these results showed that the eye color gene was present on the X chromosome and not on the Y.
These and other experiments led to the term sex-linked inheritance: inheritance of a gene that is carried on a sex chromo-some. In mammals, the X chromosome is larger and carries many more genes than the Y. For this reason, most examples of sex-linked inheritance involve genes that are carried on the X chromosome. In humans, pedigree analyses of X-linked recessive phenotypes like the one in Figure 12.22 reveal the following patterns (compare with the pedigrees of autosomal phenotypes in Figure 12.9):
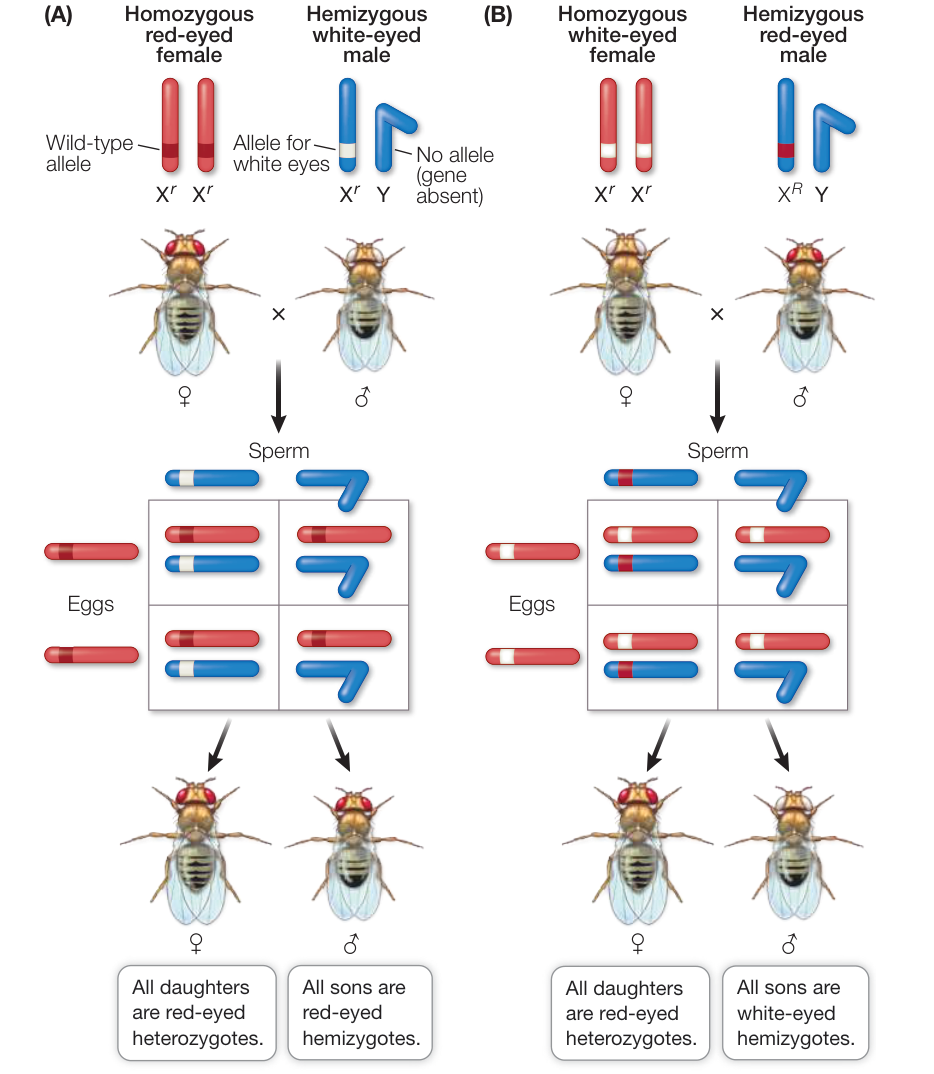
Figure 12.21 Eye Color Is a Sex-Linked Character in Drosophila Morgan demonstrated that a mutant allele that causes white eyes in Drosophila is carried on the X chromosome. A cross in which the male had white eyes and the female red eyes (A) gave different results than the reciprocal cross (B). Q: If a red-eyed female was crossed with a white-eyed male and there were white-eyed males and females in the offspring, what was the genotype of the red-eyed female?
- The phenotype appears much more often in males than in females, because only one copy of the rare allele is needed for its expression in males, whereas two copies must be present in females.
- A male with the mutation passes it on to all of his daughters; his sons get his Y chromosome.
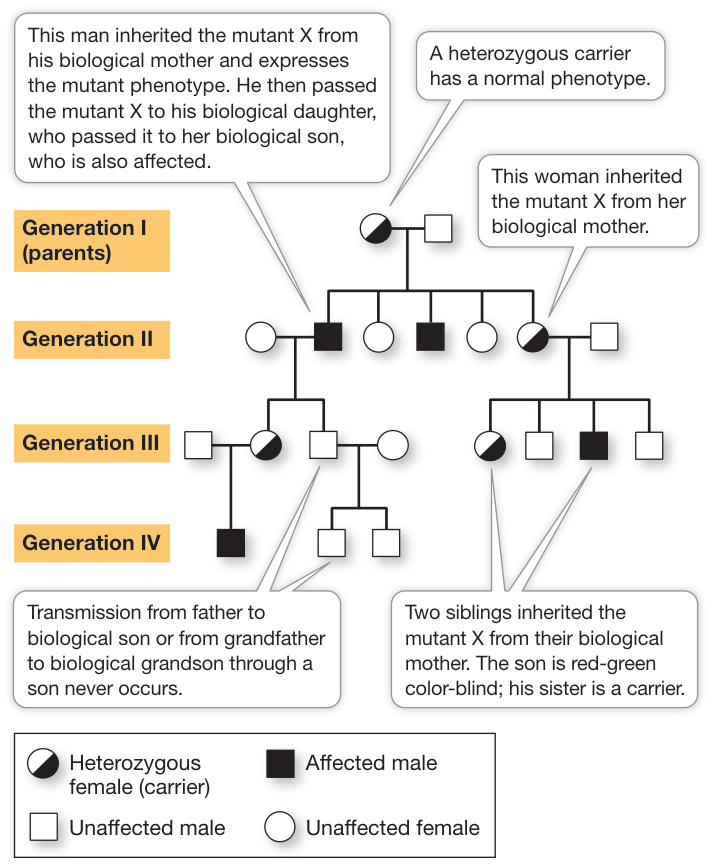
Figure 12.22 Red-Green Color Blindness Is a Sex-Linked Trait in Humans The mutant allele for red-green color blindness is expressed as an X-linked recessive trait, and therefore is always expressed in males who carry that allele.
- Daughters who receive one X-linked mutation are heterozygous carriers. They are phenotypically normal but can pass the mutant allele to their sons (who will be affected) or daughters. On average, half their children will inherit the mutant allele since half of their X chromosomes carry the normal allele.
- As is true in autosomal recessive phenotypes, an X-linked recessive phenotype can skip a generation (looking backward)—affected individuals can have unaffected parents.
Recap and Assess
Simple Mendelian ratios are not observed when genes are linked on the same chromosome. Linkage results in atypical frequencies of phenotypes in the offspring from a test cross. Calculating recombination frequencies between genes can lead to a genetic map of the genes. Sex linkage refers to genes on one sex chromosome (usually the X) that have no counterpart on the other sex chromosome.
Describe the concept of genetic linkage and its implications in genetic crosses.
Explain why red-green color blindness is more common in males than in females and why all the sons of an affected female are affected.
Sometimes scientists get lucky. Peas have a haploid number of seven chromosomes, so many of their genes are linked. The genes underlying the seven characters studied by Mendel are on four chromosomes and two are close enough to show linkage in a genetic cross. Mendel got lucky in that he never performed a dihybrid cross using that pair of characters. Suppose pure breeding parents having round, yellow (RRYY) and wrinkled, green (rryy) seeds were crossed to give an pea plant that was heterozygous for both genes (RrYy). If this double heterozygote was test-crossed, and the genes were linked with a map distance of 10 units, what would the proportions of offspring phenotypes have been?
In Drosophila, three autosomal genes have alleles as follows: Gray body color (B) is dominant over black (b). Normal wing (Vg) is dominant over vestigial (vg). Red eye (R) is dominant over sepia (r). Two crosses were performed, with the following results: Cross I: Parents: heterozygous red eye, normal wing sepia eye, vestigial wing Offspring: 131 red, normal 120 sepia, vestigial 122 red, vestigial 127 sepia, normal Cross II: Parents: heterozygous gray body, normal wing black body, vestigial wing Offspring: 236 gray, normal 253 black, vestigial 50 gray, vestigial 61 black, normal Are any of the three genes linked on the same chromosome? If so, what is the distance between the linked genes (in map units)?
The genes we’ve discussed so far in this chapter are all in the cell nucleus. You might be surprised to learn that other organelles, including mitochondria and plastids, also carry genes. What are these genes, and how are they inherited?
Some Eukaryotic Genes Are Outside the Nucleus
Learning Objective
12.5.1 Predict inheritance patterns of genes present in organelles.
The nucleus is not the only organelle in a eukaryotic cell that carries genetic material. Mitochondria and plastids contain small numbers of genes in their circular DNA molecules. For example, in humans there are about 20,500 genes coding for proteins in the nuclear genome and 37 in the mitochondrial genome. Plastid genomes are about five times larger than those of mitochondria.
Connect the Concepts Key Concept 5.5 describes the endosymbiosis theory, which proposes that some organelles—particularly mitochondria and plastids—may be descended from prokaryotes that were engulfed by other, larger cells.
The inheritance of organelle genes differs from that of nuclear genes for several reasons:
- In most organisms, mitochondria and/or plastids are inherited only from the female. As you will learn in Chapter 42, eggs contain abundant cytoplasm and organelles, but the only part of the sperm that survives to take part in the union of haploid gametes is the nucleus. So you have inherited your biological mother’s mitochondria (with their genes), but not your biological father’s. This means that characters encoded on organelle genes show differences in reciprocal crosses.
- There may be hundreds of mitochondria and/or plastids in a cell. So a cell is not diploid for organelle genes.
- Organelle genes tend to mutate at much faster rates than nuclear genes.
Although most genes for organelle proteins are in the nucleus, several of the genes carried by cytoplasmic organelles are important for organelle assembly and function, and mutations of these genes can have profound effects on the organism. The phenotypes resulting from such mutations reflect the organelles’ roles. For example, in plants and some photosynthetic protists, certain plastid gene mutations affect the proteins that assemble chlorophyll molecules into photosystems. These mutations result in a phenotype that is essentially white instead of green. A plant that inherits the white phenotype (from a flower on a white branch of a parent plant that is otherwise green) will die because it cannot synthesize carbohydrates. The inheritance of this phenotype follows a non-Mendelian, maternal pattern (Figure 12.23). Mitochondrial gene mutations that affect the respiratory chain result in reduced ATP production. In animals, these mutations have particularly noticeable effects in tissues with high energy requirements, such as the nervous system, muscles, and kidneys.
Recap and Assess
The genomes of organelles, specifically plastids and mitochondria, carry few genes, and they are usually inherited from the mother.
- A disease called Leber’s hereditary optic neuropathy is caused by a mutation in a gene carried on mitochondrial DNA. What would be the phenotype of their children if a man with this disease reproduced with a woman who did not have the disease? What would be the result if the woman had the disease and the man did not?
Mendel and those who followed him focused on eukaryotes, with diploid organisms and haploid gametes. A half-century after the rediscovery of Mendel’s work, a process that allows genetic recombination was discovered in prokaryotes as well. We now turn to that process.
Prokaryotes Can Transmit Genes by Mating
Learning Objectives
12.6.1 Outline the steps involved in the transfer of genetic material from one cell to another by bacterial conjugation.
12.6.2 Explain the consequences of conjugation for prokaryotes.
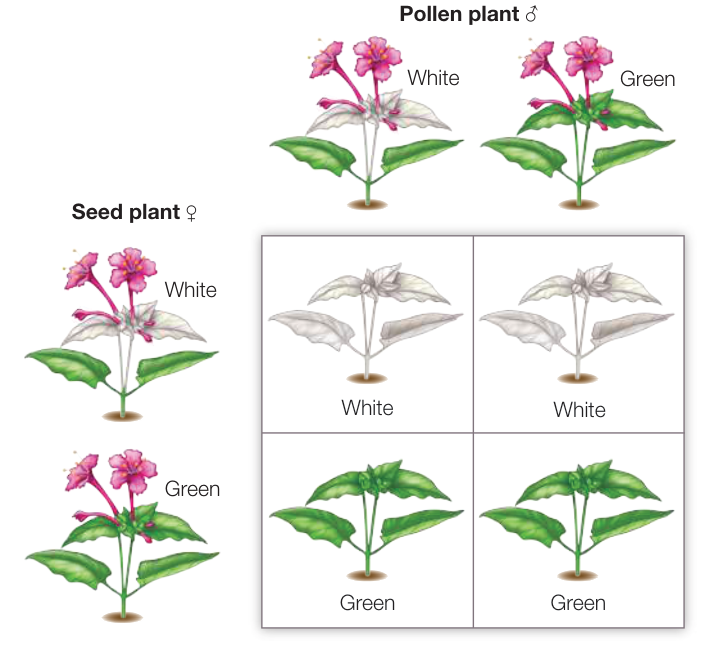
Figure 12.23 Cytoplasmic Inheritance In four o’clock plants, leaf color is inherited through the ovule only—the leaf color of the pollen parent does not matter. The white leaf color is caused by a chloroplast mutation.
As described in Chapter 5, prokaryotic cells lack nuclei; they contain their genetic material mostly as single chromosomes in central regions of their cells. Prokaryotes reproduce asexually by binary fission, a process that gives rise to progeny that are virtually identical genetically. That is, the offspring of cell reproduction in prokaryotes constitute a clone (see Chapter 11). You might expect, therefore, that there is no way for individuals of these organisms to exchange genes, as in sexual reproduction. But mutations do occur in prokaryotes just as they do in eukaryotes, and the resulting new alleles increase genetic diversity. In addition, it turns out that prokaryotes (both archaea and bacteria) do have a sexual process for transferring genes between cells. The process has been best studied in bacteria.
Bacteria exchange genes by conjugation
To illustrate the kind of experiment that led to the discovery of bacterial DNA transfer, consider two strains of the bacterium E. coli with different alleles for each of six genes. One strain carries the dominant (wild-type) alleles for three of the genes and the recessive (mutant) alleles for the other genes. This situation is reversed in the other strain. Simply put, the two strains have the following genotypes (remember that bacteria are haploid and thus have only one copy of each gene):
ABCdef and abcDEF
where capital letters indicate wild-type alleles and lowercase letters indicate mutant alleles.
When the two strains are grown together in the laboratory, most of the cells produce clones. That is, almost all of the cells that grow have the original genotypes. However, out of millions of bacteria, a few occur that have the genotype
ABCDEF
How could these completely wild-type bacteria arise? One possibility is mutation: in the abcDEF bacteria, the a allele could have mutated to A, the b allele to B, and the c allele to C. The problem with this explanation is that a mutation at any particular point in an organism’s DNA sequence is a very rare event. The probability of all three events occurring in the same cell is extremely low—much lower than the actual rate of appearance of cells with the ABCDEF genotype. So the mutant cells must have acquired wild-type genes some other way—and this turns out to be the transfer of DNA between cells.
Electron microscopy shows that genetic transfers between bacteria can happen via physical contact between the cells (Figure 12.24A). Contact is initiated by a thin projection called a sex pilus (plural pili), which extends from one cell (the donor), attaches to another (the recipient), and draws the two cells together. Genetic material can then pass from the donor cell to the recipient through a thin cytoplasmic bridge called a conjugation tube. There is no reciprocal transfer of DNA from the recipient to the donor. This process is referred to as bacterial conjugation.
Once the donor DNA is inside the recipient cell, it can recombine with the recipient cell’s genome. In much the same way that eukaryotic chromosomes pair up, gene for gene, in prophase I of meiosis, the donor DNA can line up beside its homologous sequences in the recipient, and crossing over can occur. Some of the genes from the donor can become integrated into the genome of the recipient, thus changing the recipient’s genetic constitution (Figure 12.24B). When the recipient cells proliferate, the integrated donor genes are passed on to all progeny cells.
Bacterial conjugation is controlled by plasmids
In addition to their main chromosome, many bacteria harbor additional smaller, circular DNA molecules called plasmids, which replicate independently of the main chromosome. Plasmids typically contain at most a few dozen genes, which may fall into one of several categories:
- Genes for unusual metabolic capabilities. For example, bacteria carrying plasmids that confer the ability to break down hydrocarbons can be used to clean up oil spills.
- Genes for antibiotic resistance. Plasmids carrying genes for antibiotic resistance are called R factors, and since they can be transferred between bacteria via conjugation, they are a major threat to human health.
- Genes that confer the ability to make a sex pilus.
Connect the Concepts As discussed in Key Concept 18.2, biologists can use plasmids as vectors to carry new DNA into other cells. This recombinant DNA technique may be used to produce many copies of a gene of interest, either for analysis or to produce the gene’s protein product in quantity.
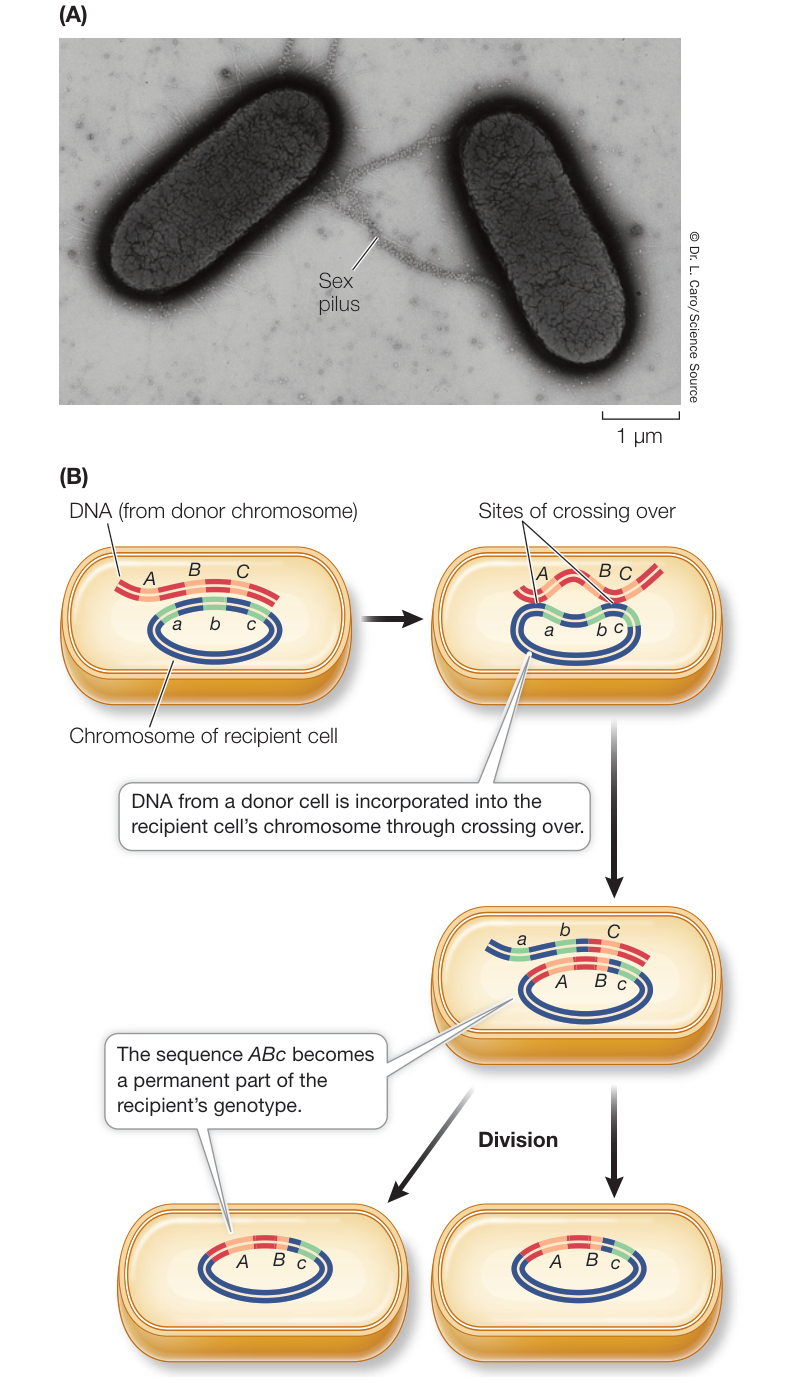
Figure 12.24 Bacterial Conjugation and Recombination (A) Sex pili draw two bacteria into close contact, so that a cytoplasmic conjugation tube can form. DNA is transferred from one cell to the other via the conjugation tube. (B) DNA from a donor cell can become incorporated into a recipient cell’s chromosome through two crossover events.
During bacterial conjugation it is usually plasmids that are transferred from one bacterium to another (Figure 12.25). A single strand of the donor plasmid is transferred to the recipient, and then synthesis of a complementary DNA strand results in two complete copies of the plasmid, one in the donor and one in the recipient.
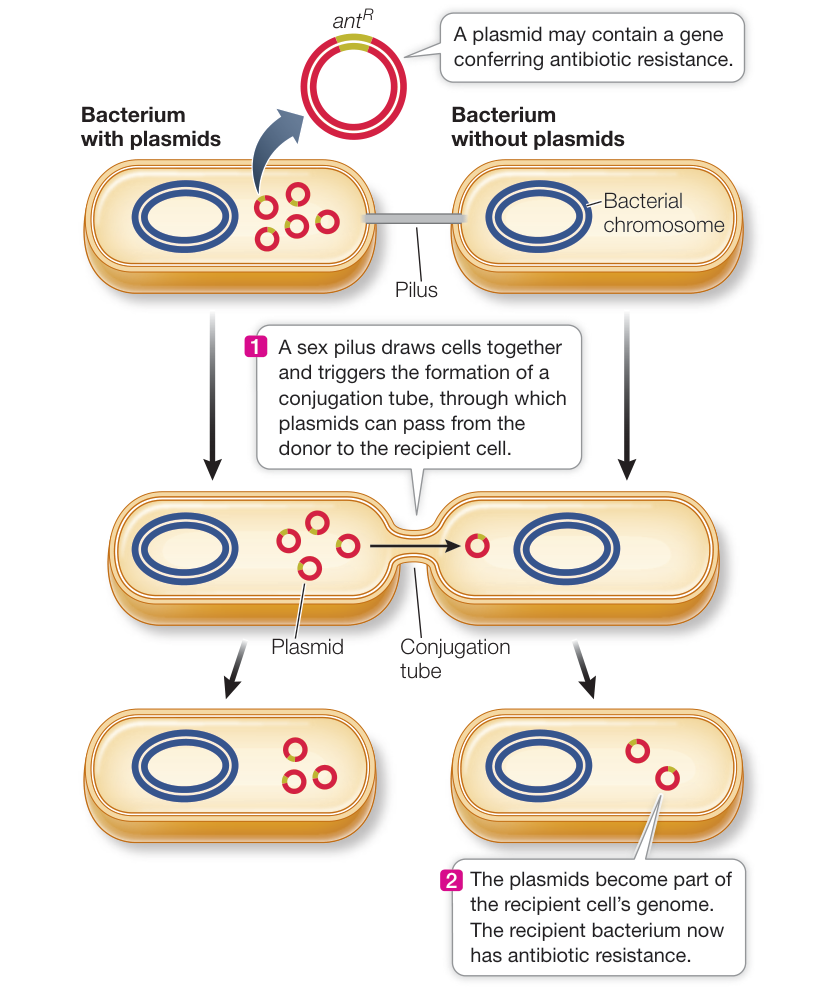
Figure 12.25 Gene Transfer by Plasmids When plasmids enter a cell via conjugation, their genes can be expressed in the recipient cell.
Recap and Assess
Although they are haploid and reproduce asexually, prokaryotes have the ability to transfer genes from one cell to another. These genes are usually carried on small, circular DNA molecules called plasmids, but chromosomal DNA is sometimes transferred as well.
- Discuss the genetic significance of mating and recombination in bacteria.
- What is the potential consequence of a plasmid being integrated into the main chromosome of a prokaryotic cell?
- How does antibiotic resistance spread via plasmids?

Activity 12.2 Concept Matching:
Inheritance, Genes, and Chromosomes
Investigating LIFE
QA How do inherited characteristics such as red hair skip generations?
Hair color is determined by the pigment melanin, which is synthesized from the amino acid tyrosine (see Table 3.2). There are two forms of this pigment, eumelanin (black or brown, depending on how much accumulates) and phaeomelanin (red or blond). Pigment production is an excellent example of intercellular signaling at work (see Chapter 7). Skin cells called melanocytes have a receptor, MC1R (melanocortin 1 receptor), for the signal melanocortin. Receptor binding sets off a signal transduction pathway that activates the cells to make much more eumelanin than phaeomelanin.
As is common with recessive traits, red hair results from a mutation in a gene, in this case a mutation in the MC1R gene, located on chromosome 16. As a recessive trait, it must be inherited from both parents to cause the hair to become red. The MC1R gene has multiple alleles: the wild type (R), which produces a normal receptor, and three recessive (r, mutated) alleles, each of which leads to red hair.
So what happens when a person inherits two of these recessive alleles? The wild-type MC1R protein is not expressed, so it does not bind the signal that would activate the eumelanin pathway, and phaeomelanin is made instead. If enough phaeomelanin accumulates, red hair results. The type of red hair that is inherited—fair, strawberry blonde, or auburn—depends on which recessive allele is inherited.
Future directions
As biologists learn more about individual genes and their alleles, they are beginning to make predictions about how gene products interact with one another and with factors in the environment. You probably know that smoking can cause lung cancer, yet there are some people who smoke a lot and don’t get the disease. It turns out that these people often carry an allele that alleviates their encounter with the harmful substances in cigarette smoke. We all have genes whose products change environmental substances. In the case of cigarette smoke, the gene product of the typical allele turns the molecules in smoke into DNA-damaging, cancer-causing toxins. People who carry a mutant form of this gene are relatively resistant to getting lung cancer from smoking because the product of this mutant gene does not carry out the activation reactions. The genomes of all organisms carry such genes that are involved in environmental interaction. Describing these genes holds promise in understanding the relative contributions of environment and genetics to establishing a phenotype.

© Picture Partners/Alamy Stock Photo
You should be able to relate each summary to the adjacent figures. If you go to this visual summary in Achieve, you can follow links to figures, animations, activities, and simulations that will help you consolidate the material.
Visual Summary
Inheritance of Genes Follows Mendelian Laws
- ■ Mendel’s law of segregation states that alleles at a gene segregate equally into gametes.
- ■ Mendel’s law of independent assortment states that alleles at different genes assort independently into gametes.
- ■ Both of Mendel’s laws can be explained by the behavior of chromosomes during meiosis.
- ■ In pedigrees, recessive traits skip generations looking back to ancestors, whereas dominant traits do not.
Questions
- A child is born with phenylketonuria, or PKU, a recessive disorder, but his parents are unaffected. What are their possible genotypes?
- What are the expected gamete frequencies from a TtPp double heterozygote if the two genes are on different chromosomes?
- A pea plant has the dominant phenotype for flower color (purple) and flower position (axial). What single cross would you perform to figure out its genotype at these two genes? Explain what the results of this cross could be.
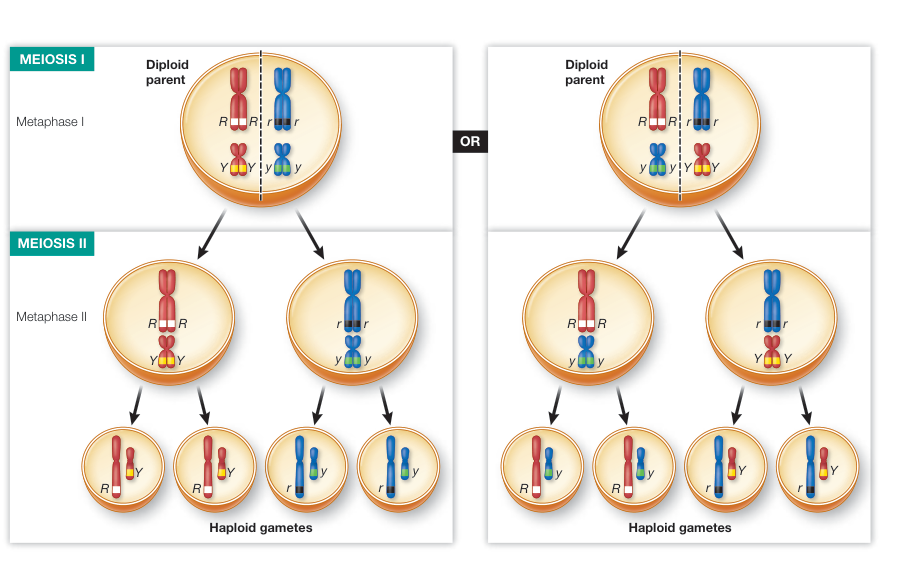
Figure 12.6
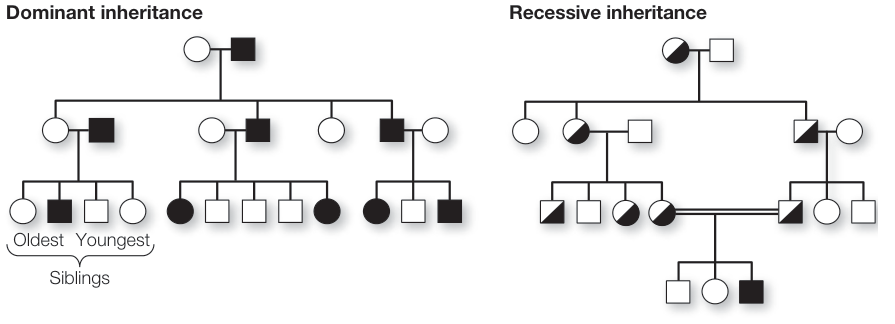
Figure 12.9
Alleles Can Produce Multiple Phenotypes
- ■ Genes often have multiple alleles.
- ■ In incomplete dominance, neither of two alleles is dominant. The heterozygous phenotype is intermediate between the homozygous phenotypes.
- ■ In codominance, the phenotypes of both homozygotes are expressed in the heterozygote.
- ■ An allele that affects more than one trait is said to be pleiotropic.
- A man with blood type AB marries a woman with blood type O. What are the possible blood types of their children?
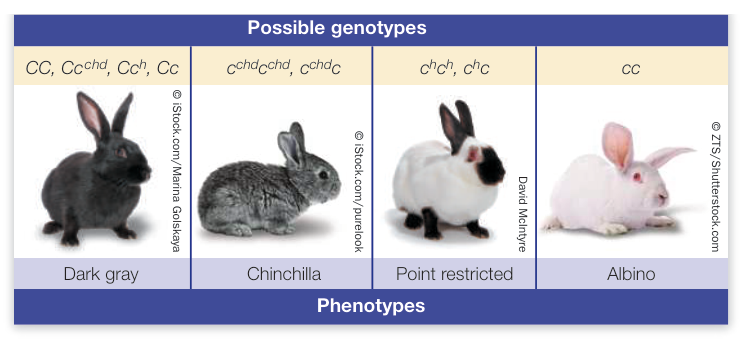
Figure 12.10
- A homozygous red-flowered plant crossed with a homozygous white-flowered plant produces pink-flowered offspring. Assuming flower color is caused by a single gene, what color offspring would be produced by selfing the plants?
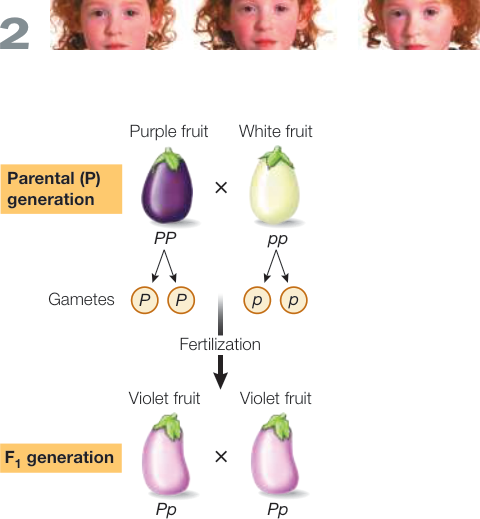
Figure 12.11
Genes Can Interact to Produce a Phenotype
- In epistasis, one gene affects the expression of another.
- Environmental conditions can affect the expression of a genotype, especially for quantitative characters.
Questions
- A true-breeding chocolate lab is bred to a true-breeding yellow lab. What are the possible phenotypes of their puppies?
- A homozygous recessive white-flowered strain of pea from Germany is crossed to a homozygous recessive white-flowered strain of pea from Australia, and all the offspring have purple flowers. How is this possible?
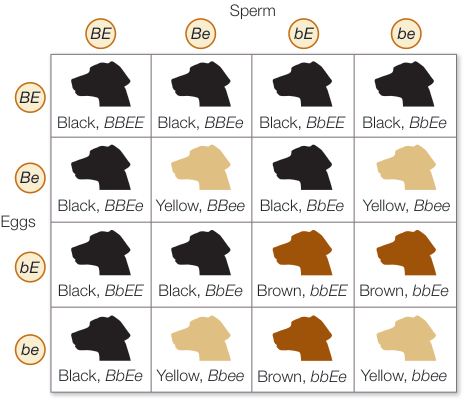
Figure 12.13
Genes Are Carried on Chromosomes
- Genes on the same chromosome can recombine by crossing over.
- Sex chromosomes vary in copy number between the sexes and can cause differences in reciprocal crosses.
Questions
- A test cross is made between a fly with straight-wings and an unstriped body, that is heterozygous for both genes underlying these characters (CucuSrs), and a homozygous curled-wing, striped-body fly (cucusrs), and the following offspring are obtained: 438 flies with straight wings and an unstriped body, 442 curled wings and striped body, 55 curled wings and unstriped body, and 65 straight wings and unstriped body. Are these genes on the same chromosome? If so, what is their map distance?
- A cross between a true-breeding scalloped-winged male fly and a true-breeding normal-winged female fly produces all normal-winged offspring. However, the reciprocal cross produces normal-winged daughters and scalloped-winged sons. Explain these results.
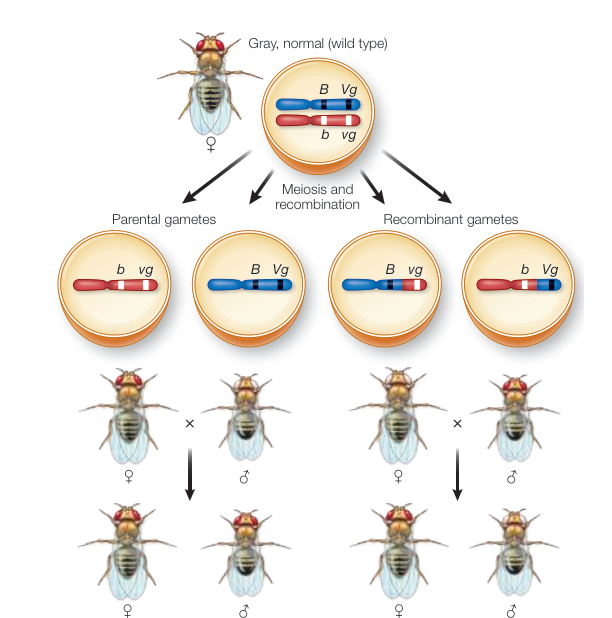
Figure 12.19
Some Eukaryotic Genes Are Outside the Nucleus
- Cytoplasmic organelles such as plastids and mitochondria are usually inherited from the biological mother.
Questions
- A cross in the fungus Neurospora of a poky (slow growing) female with a normal male results in all the offspring being poky. A reciprocal cross results in all the offspring being normal. Explain the inheritance of the poky phenotype.
- Is it possible for a single diploid cell that is not dividing to carry more than two alleles at a nuclear gene? What about at a mitochondrial gene?
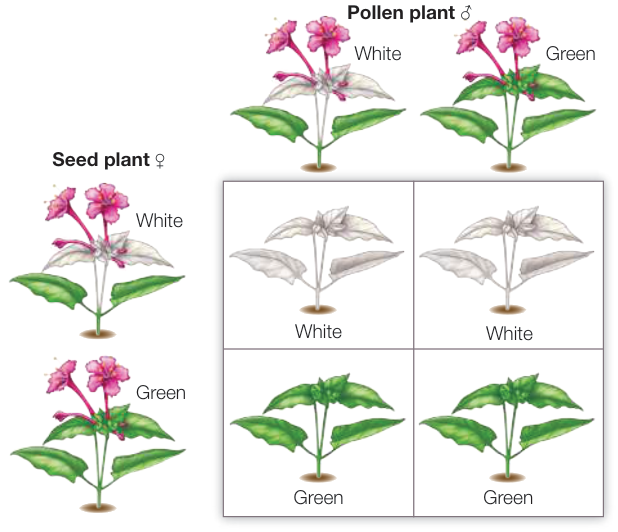
Figure 12.23
Prokaryotes Can Transmit Genes by Mating
- Prokaryotes can exchange chromosomal DNA, genes, and plasmids by conjugation.
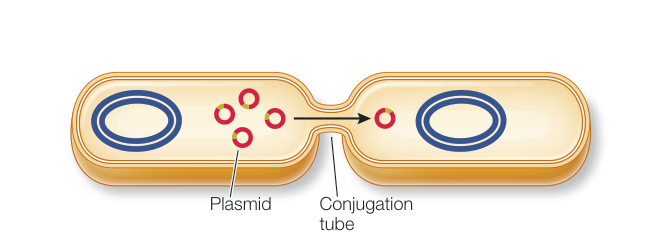
Figure 12.25
Questions
- Some bacterial cells are able to transmit genes to one another, while others are not. How might these two types of bacteria differ?
- When an antibiotic resistance gene occurs on a plasmid, it is much more likely to be transmitted through a conjugation tube than when it is on the chromosome. Why is this the case?