Chapter 19Processes of Evolution
PART FIVE The Processes and Patterns of Evolution
© blidwintel/Alamy Stock Photo
Key Concepts
- 19.1 Evolution Is Both Factual and the Basis of Broader Theory
- 19.2 Mutation, Selection, Gene Flow, Genetic Drift, and Nonrandom Mating Result in Evolution
- 19.3 Evolution Can Be Measured by Changes in Allele Frequencies
- 19.4 Selection Can Be Stabilizing, Directional, or Disruptive
- 19.5 Selection Can Maintain Variation within and among Populations
- 19.6 Evolution Is Constrained by History and Trade-Offs
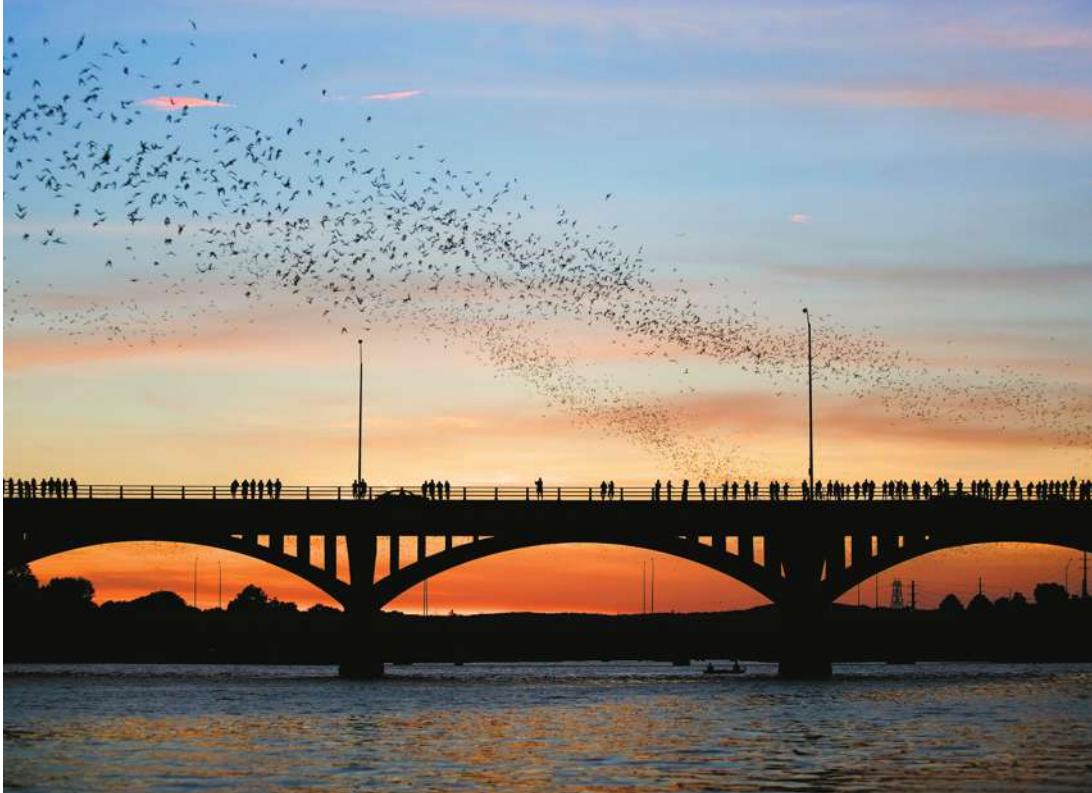
Mexican free-tailed bats (Tadarida brasiliensis) taking flight from a bridge in Austin, Texas.
Investigating Life: An Evolutionary Arms Race between Bats and Moths
Many species of bats roost by day and fly out as night approaches. The mass exodus of thousands or even millions of bats from a roost is an impressive sight, often attracting crowds of human bat-watchers. In urban areas, the cavities under bridges can attract enormous colonies of bats. People once feared these urban bat colonies, but we now know that many species of bats prey on night-flying insects, including mosquitoes and agricultural pests. Each bat can consume a third of its weight in insects per night, so just 1,000 bats consume about 4 tons of insects every year.
Most bats catch insects in flight at night. About 50 million years ago, bats evolved the ability to echolocate, which allows them to detect flying insects (such as moths) in darkness. The bats produce ultrasonic sounds, and compare these outgoing sound pulses with the returning echoes of the pulses that bounce off the flying insects. Because bats are among the greatest threats to night-flying insects, any insect that can escape detection by bats is much more likely to survive and reproduce. Inherited traits that lead to greater survival increase in the population over time as surviving insects pass these traits on to their offspring.
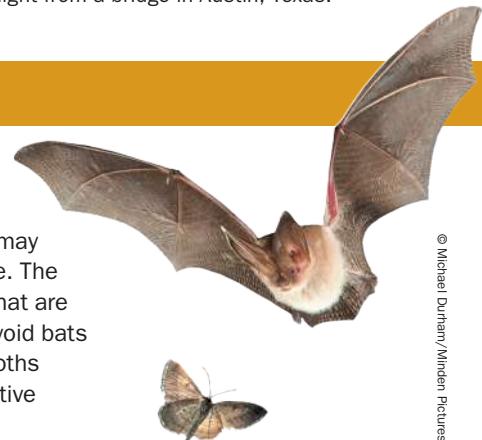
Many groups of night-flying insects, including several groups of moths, have evolved the ability to detect the ultrasonic sounds of bats. When such a moth hears a bat, it flies away from the source of the sound. If the bat is too close, the moth may dive rapidly to avoid capture. The moths in each generation that are better able to detect and avoid bats leave more offspring, so moths gradually evolve more effective escape mechanisms.
As moths get better at avoiding bats, why don’t the bats starve? Because populations of bats are evolving too. In each generation, the individual bats best able to detect and capture flying insects get the most food, which allows them to put the most effort into reproduction. Their offspring inherit their prey-detection capabilities, so populations of bats evolve more efficient insect-catching abilities, even as the moth populations evolve better escape strategies. This gradual change in both moth and bat populations is known as evolution by natural selection—a process that is constantly shaping and changing all species of life on our planet.
© Michael Durham/Minden Pictures
QA How do complex traits such as echolocation, or the ability to avoid detection by echolocation, evolve in the first place? (Find the answer on page 441.)
Evolution Is Both Factual and the Basis of Broader Theory
Learning Objectives
19.1.1 Differentiate between the everyday use of the word “theory” and a scientific theory.
19.1.2 Compare and contrast natural selection with the selection by human breeders for specific traits in domestic plants and animals.
19.1.3 Apply the principles of natural selection to predict and explain evolutionary outcomes.
All biological populations change in their genetic makeup over time. Change in the genetic composition of populations over time is called evolution. We can, and do, observe evolutionary change on a regular basis, both in laboratory experiments and in natural populations. We measure the rate at which new mutations arise, observe the spread of new genetic variants through a population, and see the effects of genetic change on the form and function of organisms. In the fossil record, we observe the long-term morphological changes (which are the result of underlying genetic changes) that have occurred among living organisms. These underlying changes in the genetic makeup of populations drive the origin and extinction of species and fuel the diversification of life.
Since we can directly observe evolution, why do we speak of “evolutionary theory”?
In addition to observing and recording physical changes over evolutionary time, biologists have accumulated a large body of evidence about how these changes occur, and about what evolutionary changes have occurred in the past. The resulting understanding of the processes of evolutionary change is known as evolutionary theory.
Evolutionary theory has many useful applications. We constantly apply it, for example, to the study and treatment of diseases. Evolutionary theory is critical to the improvement of agricultural crops and practices, and to the development of industrial processes that produce new molecules with useful properties. At a more basic level, knowledge of evolutionary theory allows biologists to understand how life diversified. It also helps us make predictions about the biological world.
In everyday speech, people tend to use the word “theory” to mean an untested hypothesis, or even a guess. But evolutionary theory does not refer to any single hypothesis, and it certainly is not guesswork. A vast and rich array of geological, morphological, behavioral, and molecular data supports the factual basis of evolution. Observations of fossils and natural populations are supported by experiments that demonstrate the basic operation of evolutionary processes.
When we refer to evolutionary theory, we are referring to our understanding of the processes that result in genetic changes in populations over time. We then apply that understanding to interpret the changes we observe in natural populations. We can directly observe the evolution of many living organisms. We can observe the yearly changes in the viruses that give us the flu, but it is evolutionary theory that allows us to apply our observations to the task of developing more effective vaccines against flu viruses.
Several processes of evolutionary change are recognized, and the scientific community is continually using evolutionary theory to expand its understanding of how and when these processes apply to particular biological problems.
Darwin and Wallace introduced the idea of evolution by natural selection
In the early 1800s, it was not yet evident to many people that populations of living organisms evolve. But several biologists had suggested that the species living on Earth had changed over time—that is, that evolution had taken place. Jean-Baptiste Lamarck, for one, presented strong evidence for the fact of evolution in 1809, but his ideas about how it occurred were not convincing. At that time, no one had yet envisioned a viable process for evolution.
In the 1820s, a young Charles Darwin became passionately interested in the subjects of geology (with its new sense of Earth’s great age) and natural history (the scientific study of how different organisms function and carry out their lives in nature). Despite these interests, he planned, at his father’s behest, to become a doctor. But surgery conducted without anesthesia nauseated Darwin, and he gave up medicine to study at Cambridge University for a career as a clergyman in the Church of England. Always more interested in science than in theology, he gravitated toward scientists on the faculty, especially the botanist John Henslow. In 1831, Henslow recommended Darwin for a position on HMS Beagle, a Royal Navy vessel that was preparing for a survey voyage around the world (Figure 19.1).
Whenever possible during the five-year voyage, Darwin went ashore to study rocks and to observe and collect plants and animals. He noticed striking differences between the species he saw in South America and those of Europe. He observed that the species of the temperate regions of South America (Argentina and Chile) were more similar to those of tropical South America (Brazil) than they were to temperate European species. When he explored the islands of the Galápagos archipelago, west of Ecuador, he noted that most of the animals were endemic to the islands (meaning they were unique and found nowhere else), although they were similar to animals found on the mainland of South America. Darwin also observed that the fauna of the Galápagos differed from island to island. He postulated that some animals had come to the archipelago from mainland South America and had subsequently undergone different changes on each of the islands. He wondered what might account for these changes.
When he returned to England in 1836, Darwin continued to ponder his observations. His thoughts were strongly influenced by the geologist Charles Lyell, who had recently popularized the idea that Earth had been shaped by slow-acting forces that are still at work today. Darwin reasoned that similar thinking could be applied to the living world. Within a decade, he had developed the framework of an explanatory theory for evolutionary change based on three major propositions:
- Species are not immutable; they change over time.
- Divergent species share a common ancestor and have diverged from one another gradually over time—a concept Darwin termed descent with modification.
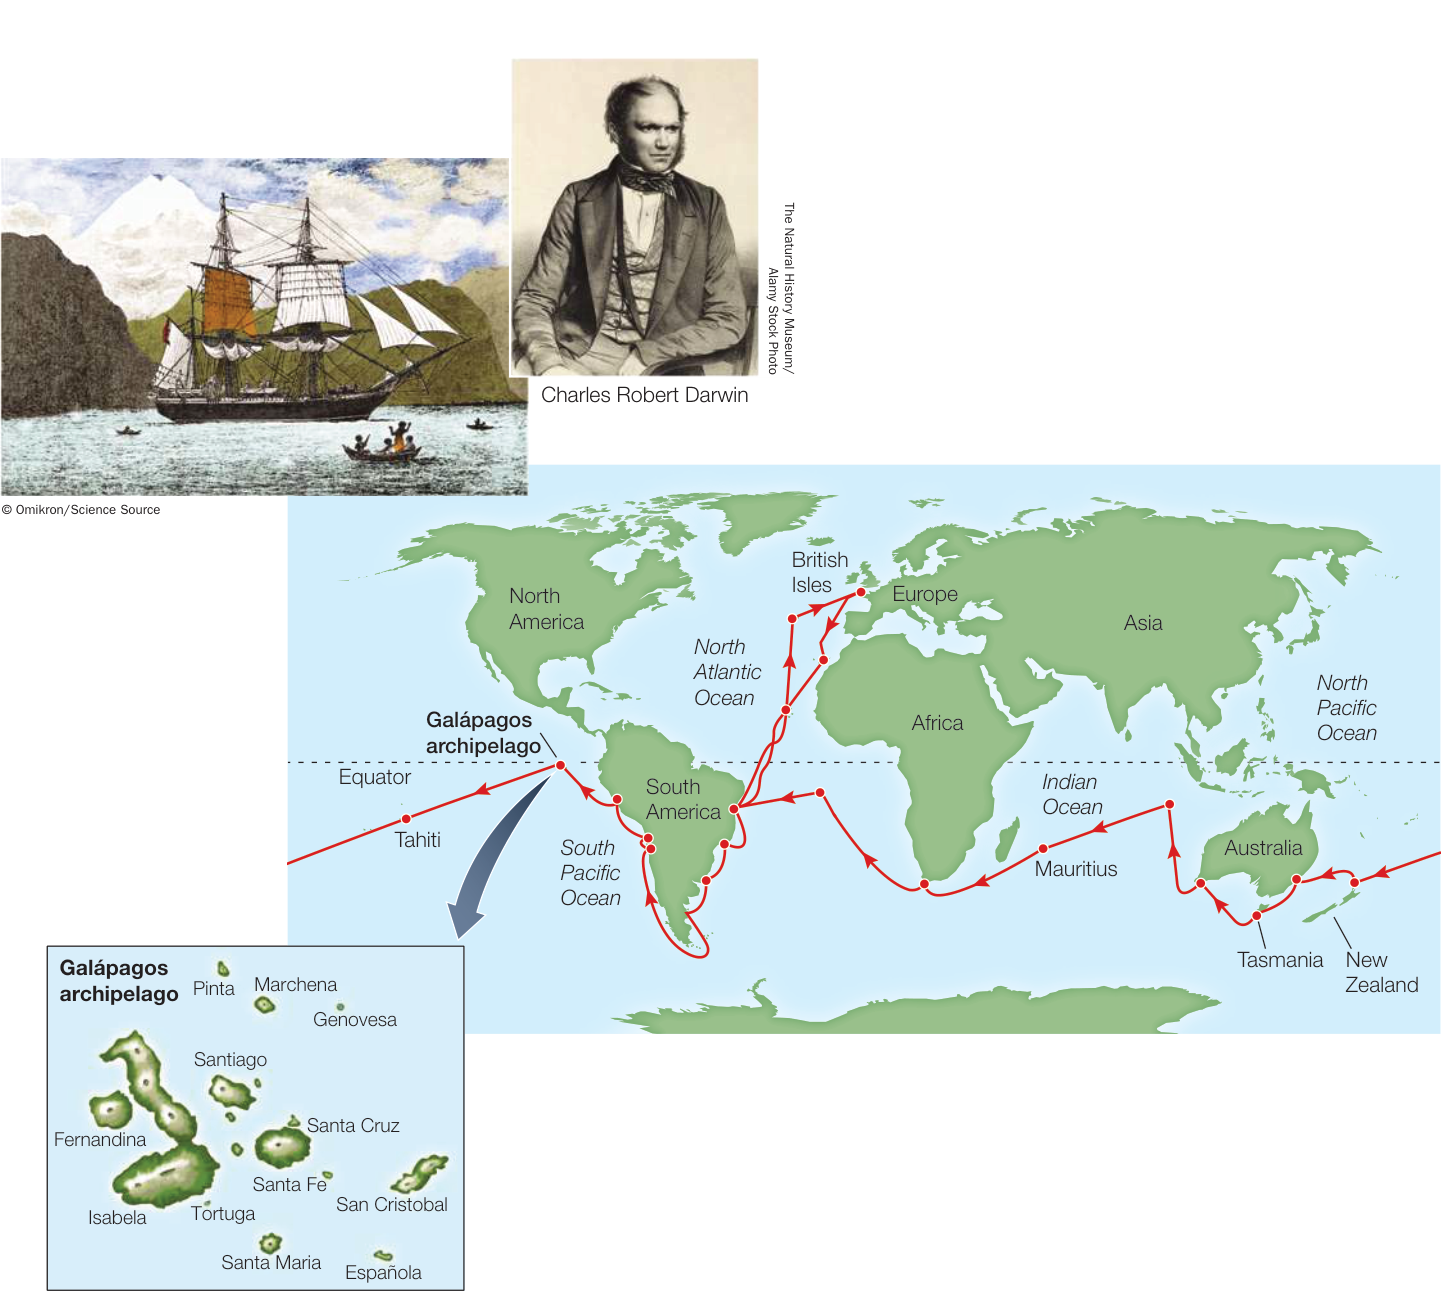
Figure 19.1 Darwin and the Voyage of the Beagle The mission of HMS Beagle was to chart the oceans and collect oceanographic and biological information from around the world. The world map indicates the ship’s path; the inset map shows the Galápagos archipelago, whose organisms were an important source of Darwin’s ideas on natural selection. The portrait is of Charles Darwin at age 27, shortly after the Beagle returned to England. Activity 19.1 Darwin’s Voyage
- Changes in species over time can be explained by natural selection: the increased survival and reproduction of some individuals compared with others, based on differences in their traits.
The first of these propositions was not unique to Darwin; several earlier authors had argued for the fact of evolution. A more revolutionary idea was his second proposition, that divergent species are related to one another through common descent. But Darwin is probably best known for his third proposition, that of natural selection.
Darwin realized that many more individuals of most species are born than survive to reproduce. He also knew that, although offspring usually resemble their parents, offspring are not identical to one another or to either parent. Finally, he was well aware that human breeders of plants and animals often selected their breeding stock based on the occurrence of particular traits that they found desirable. Over time, this selection by breeders resulted in dramatic changes in the appearance of the descendants of those plants or animals. In natural populations, wouldn’t the individuals with traits that provided the best chances of survival and reproduction be the ones most likely to pass their traits on to the next generation? Darwin called this process natural selection, to emphasize that the “selection” in nature was based on traits that increased survival and reproduction of organisms. In essence, nature, rather than a human, was doing the “selection” for which organisms would contribute the most to the next generation. To emphasize this distinction, Darwin called the selective breeding process by humans artificial selection, and emphasized that humans often selected traits in breeding stock that would confer disadvantages to reproduction or longevity in nature.
In 1844, Darwin wrote a long essay describing the role of natural selection as a process of evolution. But he was reluctant to publish it, preferring to assemble more evidence first. Darwin’s hand was forced in 1858, when he received a letter and manuscript from another traveling English naturalist, Alfred Russel Wallace, who was studying the plants and animals of the Malay Archipelago. Wallace asked Darwin to evaluate his manuscript, which included an explanation of natural selection almost identical to Darwin’s. Darwin was at first dismayed, believing Wallace to have preempted his idea. Parts of Darwin’s 1844 essay, together with Wallace’s manuscript, were presented to the Linnean Society of London on July 1, 1858, thereby crediting both men for the idea of natural selection. Darwin then worked quickly to finish his full-length book, On the Origin of Species, which was published the following year.

Animation 19.1 Natural Selection
Although Darwin and Wallace independently articulated the concept of natural selection, Darwin developed his ideas first. Furthermore, On the Origin of Species proved to be a stunning work of scholarship that provided exhaustive evidence from many fields supporting both the premise of evolution itself and the understanding of natural selection as a process of evolution. Thus both concepts are more closely associated with Darwin than with Wallace.
The publication of On the Origin of Species in 1859 stirred considerable interest (and controversy) among scientists and the public alike. Scientists spent much of the rest of the nineteenth century amassing biological and paleontological data to test evolutionary ideas and document the history of life on Earth. By 1900, the fact of biological evolution (defined at that time as change in the physical characteristics of populations over time) was established beyond any reasonable doubt. As biologists discovered the details of genetic inheritance in the twentieth century, the genetic mechanisms of evolution became clear. The development of methods for sequencing DNA in the late 1970s allowed biologists to document evolutionary changes within and between species with great precision. This technology led to explosive growth in the field of evolutionary biology. In the past four decades, well over a quarter of a million scientific papers on evolutionary observations, experiments, and theory have been published.
Recap and Assess
Evolution, or changes in the genetic composition of biological populations over time, is directly observable. Natural selection occurs when specific genetic changes increase the rates of survival or reproduction of individuals in a population relative to individuals that do not possess those changes. Under such conditions, the frequency of the favored genetic change increases in the population from one generation to the next.
Why do biologists speak of “evolutionary theory” if the facts of evolution are not in doubt?
Antibiotics are drugs that kill most bacteria, but genetic mutations can allow some individual bacteria to survive short-term exposure to these drugs. How would you expect the frequency of resistant bacteria to change over time in populations of bacteria that were exposed to an antibiotic drug on a regular basis? Why do you think antibiotics come with a warning to take the full course of the treatment, rather than stopping after you begin to feel better?
- In what ways does selection by humans in breeding agricultural crops differ from natural selection? Give an example of a trait that might be favored by artificial selection in agriculture, but selected against by natural selection in a wild population.
- Natural selection cannot adapt populations to conditions they have not experienced. Yet many organisms appear to respond to natural events before they happen. For example, many mammals go into hibernation while it is still quite warm. Similarly, many birds leave the temperate zone for their southern wintering grounds long before winter has arrived. How do you think such “anticipatory” behaviors evolve?
- As more humans live longer, many people face degenerative conditions such as Alzheimer’s disease that (in most cases) are linked to advancing age. Assuming that some individuals may be genetically predisposed to successfully combat these conditions, is it likely that natural selection alone would act to favor such a predisposition in human populations? Why or why not?
Although the importance of natural selection to evolution has been confirmed in many thousands of scientific studies, it is not the only process that drives evolution. In the next key concept we’ll consider a more complete view of evolutionary processes and how they operate.
Mutation, Selection, Gene Flow, Genetic Drift, and Nonrandom Mating Result in Evolution
Learning Objectives
19.2.1 Distinguish between the everyday and scientific uses of the terms “adapt” and “evolve.”
19.2.2 Describe how each of the five processes of evolution can result in changes in gene frequencies across generations of a population.
The word “evolution” is often used in a general sense to mean simply “change,” but in a biological context “evolution” refers specifically to change in the genetic makeup of populations over time. Developmental changes that occur in a single individual over the course of the life cycle are not the result of evolutionary change. Evolution is genetic change across generations of a population—a group of individuals of a single species that live and interbreed in a particular geographic area at the same time. It is important to remember that individuals do not evolve; populations do.
The premise of natural selection was one of Darwin’s principal insights and has been demonstrated to be an important process of evolution, but natural selection does not act alone. Four additional processes—mutation, gene flow, genetic drift, and non-random mating—affect the genetic makeup of populations over time. Before we consider how the other processes can change the frequencies of gene variants in a population, we need to understand how mutation brings such variants into existence.
Mutation generates genetic variation
The origin of genetic variation is mutation. As described in Key Concept 15.1, a mutation is any change in the nucleotide sequences of an organism’s DNA. The process of DNA replication is not perfect, and some changes appear almost every time a genome is replicated. Mutations occur randomly with respect to an organism’s needs; it is natural selection acting on this random variation that results in adaptation. Most mutations are either harmful to their bearers (deleterious mutations) or have no effect (neutral mutations). But a few mutations are beneficial, and even previously deleterious or neutral alleles may become advantageous if environmental conditions change. In addition, mutation can restore genetic variation that other evolutionary processes have removed. Thus mutation both creates and helps maintain genetic variation in populations.
Mutation rates can be high, especially in viruses and bacteria, which explains the rapid evolution of many pathogens. But in many protein-coding genes of multicellular organisms, the mutation rate is very low (on the order of to changes per base pair of DNA per generation). Even low overall mutation rates, however, create considerable genetic variation, because each of a large number of genes may change, and populations often contain large numbers of individuals. For example, if the probability of a point mutation (an addition, deletion, or substitution of a single base) were per base pair per generation, then each human gamete—the DNA of which contains base pairs—would average three new point mutations (), and each zygote would carry an average of six new mutations. The current human population of about 7 billion people would thus be expected to carry about 42 billion new mutations (i.e., changes in the nucleotide sequences of their DNA that were not present one generation earlier). So even though the mutation rate in humans is low, human populations still contain enormous genetic variation on which other evolutionary processes can act.
As a result of mutation, different forms of a gene, known as alleles, may exist at a particular chromosomal locus (see Key Concept 12.1). At any particular locus, a single diploid individual has no more than two of the alleles found in the population to which it belongs. The sum of all copies of all alleles at all loci found in a population constitutes that population’s gene pool (Figure 19.2). (We can also refer to the gene pool for a particular chromosomal locus or loci.) The gene pool is the sum of the genetic variation in the population. The proportion of each allele in the gene pool is the allele frequency. Likewise, the proportion of each genotype among individuals in the population is the genotype frequency.
A simple experiment demonstrates how mutations accumulate in populations in a continual, almost constant fashion over time (Figure 19.3). Lines of the bacterium E. coli were grown in the laboratory for 20,000 generations, and the genomes were sequenced from individuals in the experimental lines at least once every 5,000 generations. Over the experiment, the lines accumulated about 45 changes to their genomes, and these changes appeared at a fairly constant rate over time. Populations of all living organisms experience a similar accumulation of mutations over time (although the rate of change differs among species), and these changes provide the raw material for evolution.
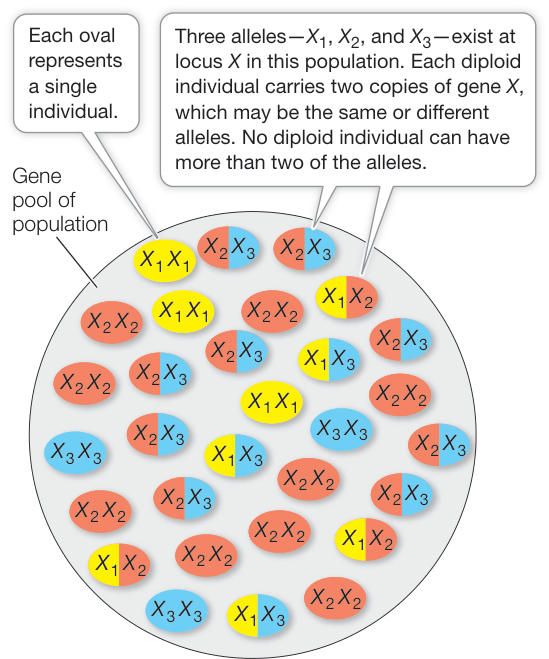
Figure 19.2 A Gene Pool A gene pool is the sum of all the alleles found in a population or at a particular locus in that population. This figure shows the gene pool for one locus, , in a population of diploid organisms. The allele frequencies in this case are 0.20 for , 0.50 for , and 0.30 for (see Figure 19.10).
Connect the Concepts As discussed in Key Concept 12.1, alleles of different genes assort independently in meiosis. The frequencies with which different allele combinations will be expressed in offspring can be calculated using a Punnett square or probability theory.
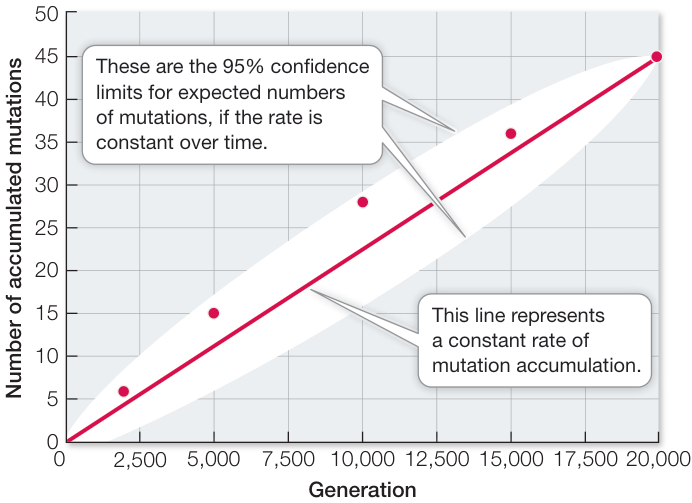
Figure 19.3 Mutations Accumulate Continually An experimental lineage of the bacterium Escherichia coli was propagated in the laboratory for 20,000 generations. Genomes were sequenced from individuals sampled at various points during the experiment and were compared with the genome of the ancestral clone. Note that mutations accumulated at a relatively constant rate throughout the experiment. (After J. E. Barrick et al. 2009. Nature 461: 1245–1247.)
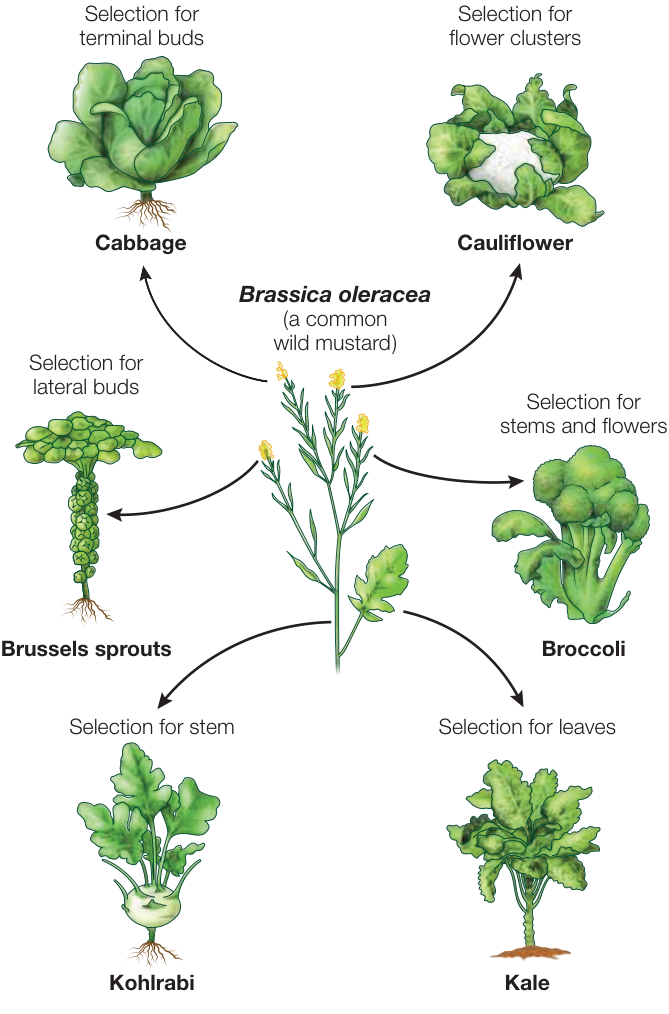
Figure 19.4 Many Vegetables from One Species All the crop plants shown here derive from a single wild mustard species. European agriculturalists produced these cultivars by selecting and breeding plants with unusually large buds, stems, leaves, or flowers. The results substantiate the vast amount of variation present in the gene pool of the ancestral species.
Selection acting on genetic variation leads to new phenotypes
As a result of mutation, the gene pools of nearly all populations contain variation for many traits. Selection that favors different traits can lead to distinctively different lineages that descend from the same ancestor. For example, artificial selection for different traits in a single European species of wild mustard produced many important crop plants (Figure 19.4). Agriculturalists were able to achieve these results because the original mustard population had genetic variation for the characters of interest (such as stem thickness or number of leaves).
Darwin compared artificial selection, which was commonly practiced by animal and plant breeders, with natural selection that occurred in natural populations. Many of Darwin’s observations on the nature of variation and selection came from domesticated plants and animals. Darwin bred pigeons and thus knew firsthand the astonishing diversity in color, size, form, and behavior that breeders could achieve (Figure 19.5). He recognized close parallels between selection by breeders and selection in nature. Whereas artificial selection resulted in traits that were preferred by the human breeders, natural selection resulted in traits that helped organisms survive and reproduce more effectively. In both cases, selection simply increased the frequency of the favored trait from one generation to the next.
Laboratory experiments also demonstrate the existence of considerable genetic variation in populations, and show how this variation can lead to evolution through selection. In one such experiment, investigators bred populations of the fruit fly Drosophila melanogaster with high or low numbers of bristles on their abdomens from an initial population with intermediate numbers of bristles. After 35 generations, all flies in both the high-and low-bristle lineages had bristle numbers that fell well outside the range found in the original population (Figure 19.6). Selection for high and low bristle numbers resulted in new combinations of the many different genes that were present in the original population, so that the phenotypic variation seen in subsequent generations fell outside the phenotypic variation seen in the original population.
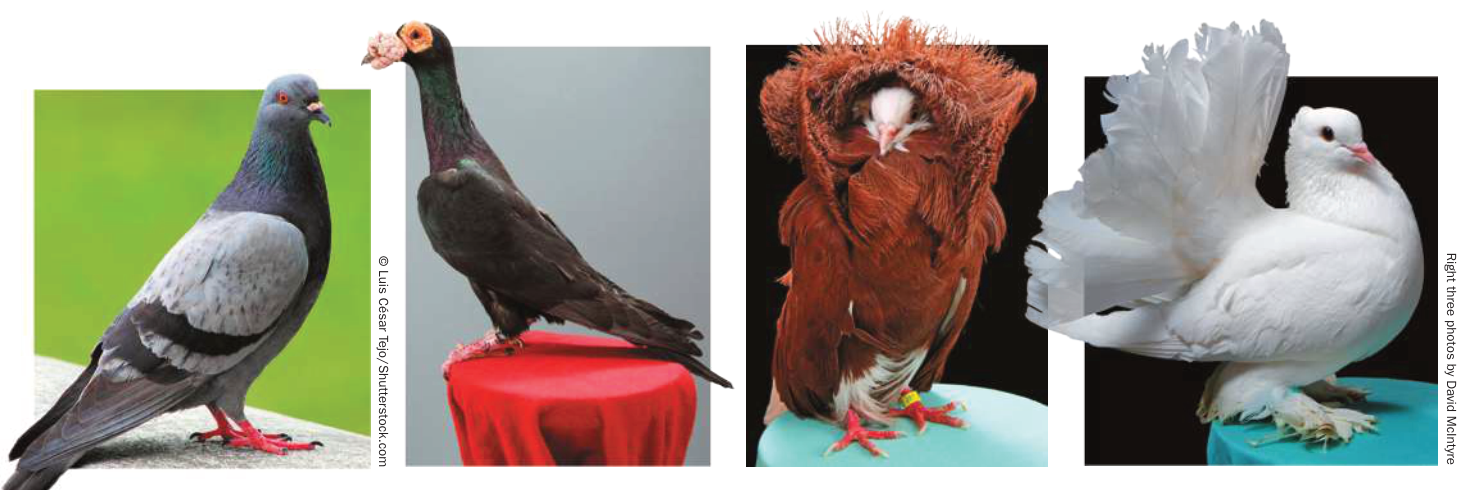
Figure 19.5 Artificial Selection Charles Darwin, who raised pigeons as a hobby, noted similar forces at work in artificial and natural selection. The “fancy” pigeons shown here represent 3 of the more than 300 varieties derived from the wild Rock Pigeon (Columba livia; far left) by artificial selection on characters such as color and feather distribution.
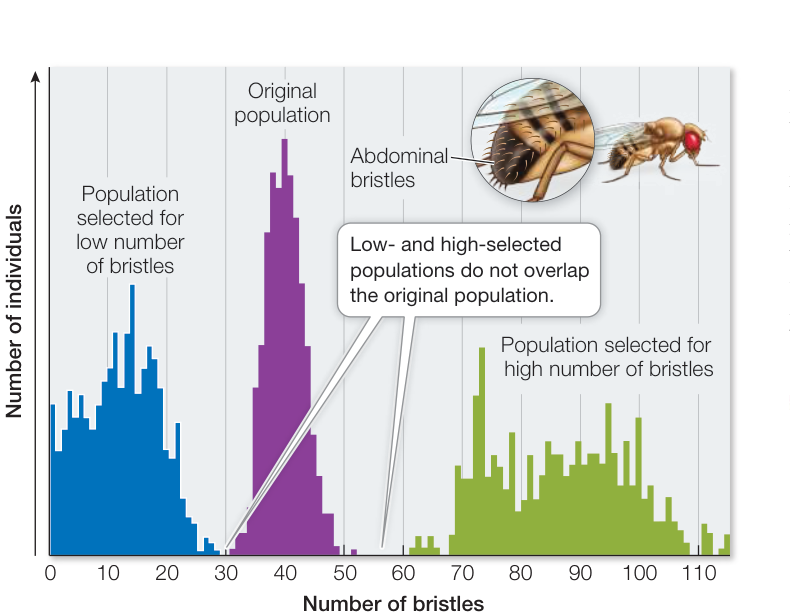
Figure 19.6 Artificial Selection Reveals Genetic Variation When investigators subjected Drosophila melanogaster to artificial selection for abdominal bristle number, that character evolved rapidly. The graph shows the number of flies with different numbers of bristles in the original population and after 35 generations of artificial selection for low and for high bristle numbers. (After G. A. Clayton et al. 1956. J Genet 55: 131–151.) Q: How did flies in the selected populations end up with fewer or more bristles than were observed in any of the flies in the original population?
Natural selection increases the frequency of beneficial mutations in populations
Darwin knew that far more individuals of most species are born than survive to reproduce. He also knew that, although offspring tend to resemble their parents, the offspring of most organisms are not identical either to their parents or to one another. He suggested that slight differences among individuals affect the chance that a given individual will survive and reproduce, which increases the frequency of the favored trait in the next generation. A favored trait that spreads through a population by natural selection is known as an adaptation; this word is used to describe both the trait itself and the process that produces the trait.
Biologists regard an organism as being adapted to a particular environment when they can demonstrate that a slightly different organism reproduces and survives less well in that environment. To understand adaptation, biologists compare the performances of individuals that differ in their traits.
In the story that opens this chapter, we learned that many groups of moths have evolved the ability to detect ultrasounds of bats, which allows the moths to fly away from the bats or use evasive flight behavior to avoid predation. But many species of moths are unable to hear bats, so these moths have to rely on other strategies to avoid bat detection. As described in Investigating Life: Do Long Wing Tails Help Moths Escape Bat Predation?, Jesse Barber and his colleagues noticed that several groups of non-hearing moths have long extensions of their wings (“wing tails”), and they wondered if these structures might serve to distract echolating bats and allow the moths to escape. To find out, the researchers cut the wing tails off some individual moths and compared the rates of bat predation, and flight performance, in the moths with and without wing tails. They found that the wing tails had very little effect on a moth’s flying efficiency, but conveyed a huge advantage in reducing bat predation. The wing tails flutter as the moths fly, and the echolocation system of the bats is more likely to locate the fluttering nonessential wing tail than the body of the moth, thereby allowing a moth to survive a bat attack. Thus the wing tails appear to be an adaptation that helps moths avoid bat predation.
Gene flow may change allele frequencies
Few populations are completely isolated from other populations of the same species. Migration of individuals and movements of gametes (in pollen, for example) between populations—a phenomenon called gene flow—can change allele frequencies in a population. If the arriving individuals survive and reproduce in their new location, they may add new alleles to the population’s gene pool, or they may change the frequencies of alleles present in the original population.
Connect the Concepts If gene flow between two populations stops, those populations may diverge and become different species; see Key Concept 22.2.
Genetic drift may cause large changes in small populations
In small populations, genetic drift—random changes in allele frequencies from one generation to the next—may produce large changes in allele frequencies over time. Harmful alleles may increase in frequency, and rare advantageous alleles may be lost. Even in large populations, genetic drift can influence the frequencies of neutral alleles (which do not affect the survival and reproductive rates of their bearers).
To illustrate the effects of genetic drift, suppose there are only two females in a small population of normally brown mice, and one of these females carries a newly arisen dominant allele that produces black fur. Even in the absence of any selection, it is unlikely that the two females will produce exactly the same number of offspring. Even if they do produce identical litter sizes and identical numbers of litters, chance events that have nothing to do with genetic characteristics are likely to result in differential mortality among their offspring. If each female produces one litter, but a flood envelops the black female’s nest and kills all of her offspring, the novel allele could be lost from the population in just one generation. In contrast, if the brown female’s litter is lost, then the frequency of the newly arisen allele (and phenotype) for black fur will rise dramatically in just one generation.
► Investigating LIFE Do Long Wing Tails Help Moths Escape Bat Predation?
Experiment
Original Paper: J. R. Barber et al. 2015. Moth tails divert bat attack: Evolution of acoustic deflection. Proc Nat Acad Sci USA 112: 2812–2816.
Many groups of moths have evolved the ability to hear the ultra-sounds that bats produce for echolocation. These moths can then use evasive behavior to avoid predation by the bats. But almost half of all moths lack ears to hear the sounds produced by bats. Jesse Barber and his colleagues noticed that many non-hearing moths have long, posterior wing extensions (“wing tails”), and wondered if these wing tails might serve to deflect attacks by echolocating bats.
HYPOTHESIS As the long tails on moth wings flutter in flight, they serve to deflect the attacks of echolocating bats.
METHOD
- Remove the wing tails from an experimental group of luna moths (Actias luna).
- In an experimental setting, compare the capture rate by big brown bats (Eptesicus fuscus) of moths with and without wing tails.
- Control for the effects of wing tail size by conducting comparable experiments on moths with various wing tail sizes, in species that naturally lack wing tails.
- Compare the flying efficiency of luna moths with and without wing tails, to test the possibility that wing tails improve flying performance.
RESULTS The successful capture rate by bats of luna moths was much higher in moths that had their wing tails removed. Large wing tail size does seem to have an effect on reducing successful preda-tion as well, but the long wing tails of luna moths provide a much greater benefit to predation avoidance than predicted by the increase in wing tail size alone. The removal of wing tails from luna moths had no significant effect on the flight performance of the moths. The graph shows successful capture rate by bats of luna moths with and without wing tails. Brackets show 95% confidence intervals.
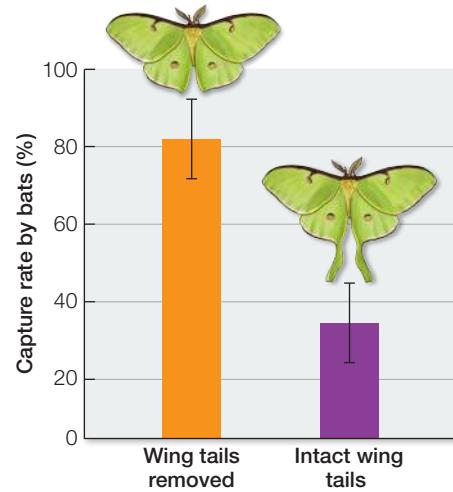
CONCLUSION The tail extensions on the wings of luna moths reduce the rate of successful bat attacks on the moths. Bats attack the fluttering wing tails of luna moths rather than their bodies, allowing the moths to escape. The wing tails do not provide improvements in flight performance, but rather in predation avoidance.
Genetic drift is especially potent when a population is reduced dramatically in size. Even populations that are normally large may occasionally pass through environmental events that only a small number of individuals survive, a situation known as a population bottleneck. The effect of genetic drift in such a situation is illustrated in Figure 19.7, in which red and yellow beans represent two alleles of a gene. Most of the beans in the small sample of the “population” that “survives” the bottleneck event are, just by chance, red, so the new population has a much higher frequency of red beans than the previous generation had. In a real population, the red and yellow allele frequencies would be described as having “drifted.”
A population forced through a bottleneck is likely to lose much of its genetic variation. For example, when Europeans first arrived in North America, millions of Greater Prairie-Chickens
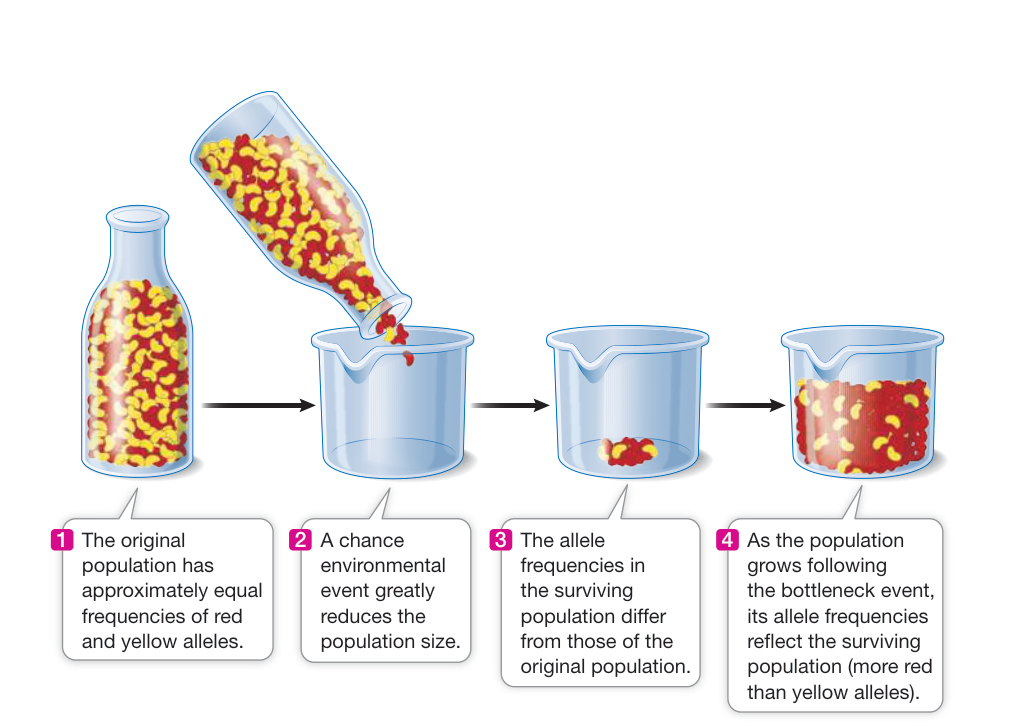
Figure 19.7 A Population Bottleneck Population bottlenecks occur when only a few individuals survive a random event. The result may be a change in allele frequencies within the population.
Work with the Data
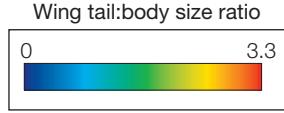
The experiment shows that the wing tails of luna moths reduce the rate of successful predation by bats. Is this innovation unique to luna moths? Jesse Barber and his colleagues conducted a phylogenetic analysis of moths to understand the evolutionary history of this innovation and how many times it has evolved within moths. Phylogenetic trees were introduced in Chapter 1, and we will discuss them in greater detail in Chapter 20. These diagrams trace the evolutionary history of a group (such as moths) through time, as lineages diverge from a common ancestor. The diagram here shows the phylogeny of moths as reconstructed by the investigators, with seven of the moth species illustrated. The colors of the branches indicate the reconstructed wing tail:body size ratio. Moths along dark blue branches lack obvious wing tails, whereas moths along light blue, green, yellow, and red branches have progressively longer wing tails.
QUESTIONS
- Based on the phylogenetic tree, how many times do you think wing tail extensions have evolved in moths?
- Within a group of moths that have evolved wing tails (such as the close relatives of luna moths), is there any evidence for selection for increased wing tail length?
(Tympanuchus cupido) inhabited the midwestern prairies. As a result of hunting and habitat destruction by the new settlers, the Illinois population of this species plummeted from about 100 million birds in 1900 to fewer than 50 individuals in the 1990s. A comparison of DNA from birds collected in Illinois during the middle of the twentieth century with DNA from the surviving population in the 1990s showed that Illinois prairie-chickens have lost most of their genetic diversity. Loss of genetic variation in small populations is one of the problems facing biologists who attempt to protect endangered species.
Genetic drift can have similar effects when a few pioneering individuals colonize a new region. Because of its small size, the colonizing population is unlikely to possess all of the alleles found in the gene pool of its source population. The resulting change in genetic variation, called a founder effect, is equivalent to that in a large population reduced by a bottleneck.
Nonrandom mating can change genotype or allele frequencies
Mating patterns often alter genotype frequencies because the individuals in a population do not choose mates at random. For example, self-fertilization is common in many groups of organisms, especially plants. Any time individuals mate preferentially with other individuals of the same genotype (including themselves), homozygous genotypes will increase in frequency and heterozygous genotypes will decrease in frequency over time. The opposite effect (more heterozygotes, fewer homozygotes) is expected when individuals mate primarily or exclusively with individuals of different genotypes.
Many nonrandom mating systems produce changes in genotype frequencies but not in allele frequencies, and thus do not, by themselves, result in evolutionary change in a population. However, nonrandom mating systems that result in different reproductive success among individuals do produce allele frequency changes from one generation to the next. One such process, sexual selection, occurs when individuals of one sex mate preferentially with particular individuals of the opposite sex rather than at random.
Sexual selection was first suggested by Charles Darwin, who developed the idea to explain the evolution of conspicuous traits that would appear to inhibit survival, such as bright colors and elaborate courtship displays in males of many species. He hypothesized that these features either improved the ability of their bearers to compete for access to mates (intrasexual selection) or made their bearers more attractive to members of the opposite sex (intersexual selection).
Darwin argued that while natural selection typically favors traits that enhance the survival of their bearers or their bearers’ descendants, sexual selection is primarily about successful reproduction. An animal that survives but fails to reproduce makes no contribution to the next generation. Thus sexual selection may favor traits that enhance an individual’s chances of reproduction even when these traits reduce its chances of survival. For example, females may be more likely to see or hear males with a given trait (and thus be more likely to mate with those males), even though the favored trait also increases the chances that the male will be seen or heard by a predator.
One example of a trait that Darwin attributed to sexual selection is the remarkable tail of the male African Long-tailed Widowbird (Euplectes progne), which is longer than the bird’s head and body combined (Figure 19.8). Male widowbirds normally select, and defend from other males, a territory where they perform courtship displays to attract females. To investigate whether sexual selection drove the evolution of widowbird tails, a biologist clipped the tails of some captured male widowbirds and lengthened the tails of others by gluing on additional feathers. He then cut and reglued the tail feathers of still other males, which served as controls. Both short-and long-tailed males successfully defended their display territories, indicating that a long tail does not confer an advantage in male–male competition. However, males with artificially elongated tails attracted about four times more females than did males with shortened tails (Figure 19.9). Thus males with long tails pass on their genes to more offspring than do males with short tails, which leads to the evolution of this unusual trait.
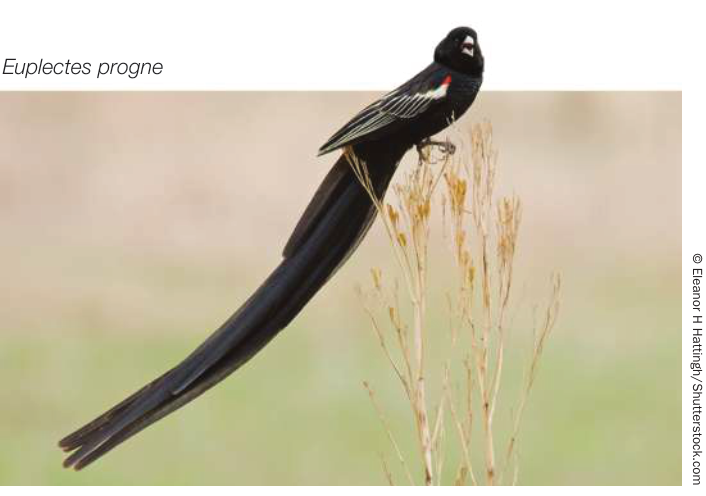
Figure 19.8 What Is the Advantage? The extensive tail of the male African Long-tailed Widowbird inhibits its ability to fly. Darwin attributed the evolution of this seemingly nonadaptive trait to sexual selection.
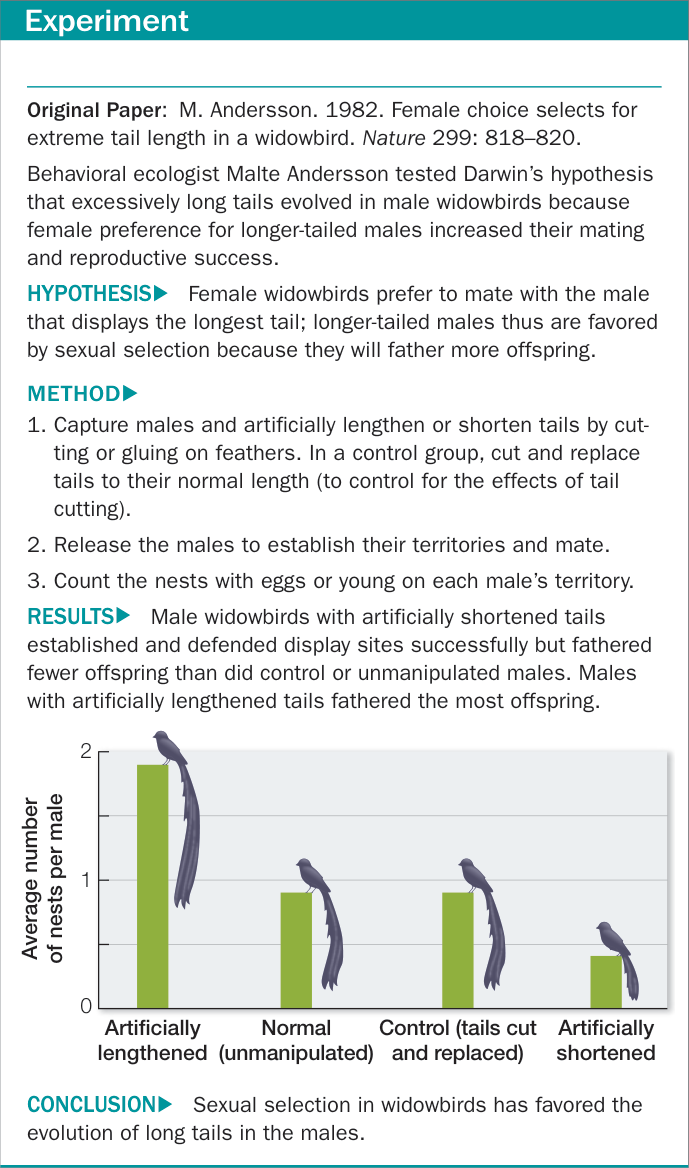
Figure 19.9 Sexual Selection in Action
Recap and Assess
Evolutionary processes change the genetic structure of a population from one generation to the next. These processes include mutation, natural selection, gene flow, genetic drift, and nonrandom mating.
- In everyday language, we speak of individuals “evolving” over their lifetime (if, for example, they change their opinion about an issue). This sense of “evolving” is clearly very different than what biologists mean when they refer to biological evolution. Explain why changes within an individual’s lifetime are not examples of biological evolution.
- How is mutation a necessary component of the evolutionary processes?
- What kinds of traits would be more likely to evolve by genetic drift than by natural selection?
- Describe conditions in which nonrandom mating does and does not lead to evolution.
- Why might gene flow slow the evolution of a population?
The processes of mutation, natural selection, gene flow, genetic drift, and nonrandom mating can all result in evolutionary change. We will consider next how evolutionary change that results from these processes is measured.
Evolution Can Be Measured by Changes in Allele Frequencies
Learning Objectives
- 19.3.1 Calculate the allele frequencies for two alleles at a given locus in a diploid population.
- 19.3.2 Calculate observed and expected genotype frequencies from allele frequencies based on the principles of Hardy–Weinberg equilibrium.
- 19.3.3 Interpret data and formulate hypotheses to explain deviations from Hardy–Weinberg expectations in observed genotype frequencies.
Much of evolution occurs through gradual changes in the relative frequencies of different alleles in a population from one generation to the next. Major genetic changes can also be sudden, as happens when two formerly separated populations merge and hybridize, or when genes within a population are duplicated within the genome. But in most cases, we measure evolution by looking at changes in allele and genotype frequencies in populations over time.
A population’s genetic structure can be described by frequencies of alleles and genotypes
To measure allele frequencies in a population precisely, we would need to count every allele at every locus in every individual in the population. Fortunately, we do not need to make such complete measurements because we can reliably estimate allele frequencies for a given locus by counting alleles in a reasonably sized sample of individuals from the population. The sum of all allele frequencies at a locus is equal to 1, so measures of allele frequency range from 0 to 1.
An allele’s frequency is calculated using the following formula:
If only two alleles (we’ll call them A and a) for a given locus are found among the members of a diploid population, those alleles can combine to form three different genotypes: AA, Aa, and aa. A population with more than one allele at a locus is said to be polymorphic (“many forms”) at that locus. Applying the formula just mentioned, as shown in Figure 19.10, we can calculate the relative frequencies of alleles A and a in a population of N individuals as follows:
- Let be the number that are homozygous for the A allele (AA).
- Let be the number that are heterozygous (Aa).
- Let be the number that are homozygous for the a allele (aa).
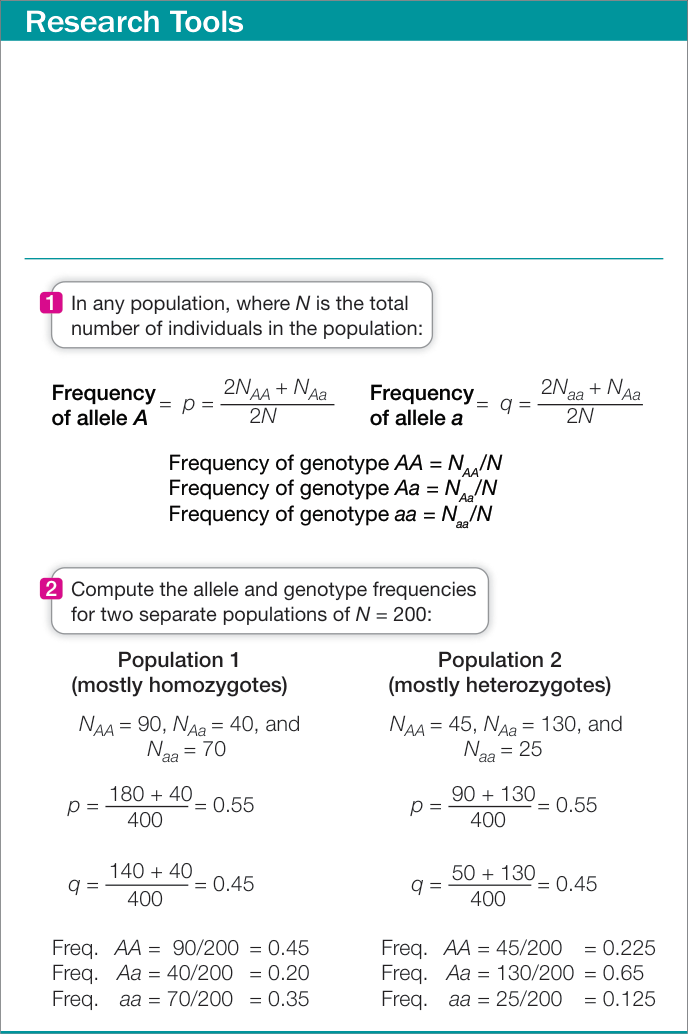
Figure 19.10 Calculating Allele and Genotype Frequencies Allele and genotype frequencies for a gene locus with two alleles in the population can be calculated using the equations in panel 1. When the equations are applied to two populations (panel 2), we find that the frequencies of alleles A and a in the two populations are the same, but the alleles are distributed differently between heterozygous and homozygous genotypes. Figure 19.10 Calculating Allele and Genotype Frequencies Allele and genotype frequencies for a gene locus with two alleles in the population can be calculated using the equations in panel 1. When the equations are applied to two populations (panel 2), we find that the frequencies of alleles A and a in the two populations are the same, but the alleles are distributed differently between heterozygous and homozygous genotypes.
Note that , the total number of individuals in the population, and that the total number of copies of both alleles present in the population is , because each individual is diploid. Each individual has two copies of the allele, and each individual has one copy of the allele. Therefore the total number of alleles in the population is . Similarly, the total number of alleles in the population is . If represents the frequency of , and represents the frequency of , then and
The calculations in Figure 19.10 demonstrate two important points. First, notice that for each population, , which means that . So when there are only two alleles at a given locus in a population, we can calculate the frequency of one allele and obtain the second allele’s frequency by subtraction. If there is only one allele at a given locus in a population, its frequency is 1: the population is then monomorphic at that locus, and the allele is said to be fixed.
Second, notice that population 1 (consisting mostly of homozygotes) and population 2 (consisting mostly of heterozygotes) have the same allele frequencies for and . Thus they have the same gene pool for this locus. Because the alleles in the gene pool are distributed differently among individuals, however, the genotype frequencies of the two populations differ.
The frequencies of the different alleles at each locus and the frequencies of the different genotypes in a population describe that population’s genetic structure. Allele frequencies measure the amount of genetic variation in a population, whereas genotype frequencies show how a population’s genetic variation is distributed among its members. Other measures, such as the proportion of loci that are polymorphic, are also used to measure variation in populations. With these measurements, it becomes possible to consider how the genetic structure of a population changes or remains the same over generations—that is, to measure evolutionary change.
Evolution will occur unless certain restrictive conditions exist
In 1908, the British mathematician Godfrey Hardy and the German physician Wilhelm Weinberg independently deduced the conditions that must prevail if the genetic structure of a population is to remain the same over time. If the conditions they identified do not exist, then evolution will occur. The resulting principle is known as Hardy–Weinberg equilibrium. Hardy–Weinberg equilibrium describes a model in which allele frequencies do not change across generations and genotype frequencies can be predicted from allele frequencies (Figure 19.11). The principles of Hardy–Weinberg equilibrium apply only to sexually reproducing organisms. Several conditions must be met for a population to be at Hardy–Weinberg equilibrium. Note that the following conditions correspond inversely to the five principal processes of evolution (discussed in Key Concept 19.2):
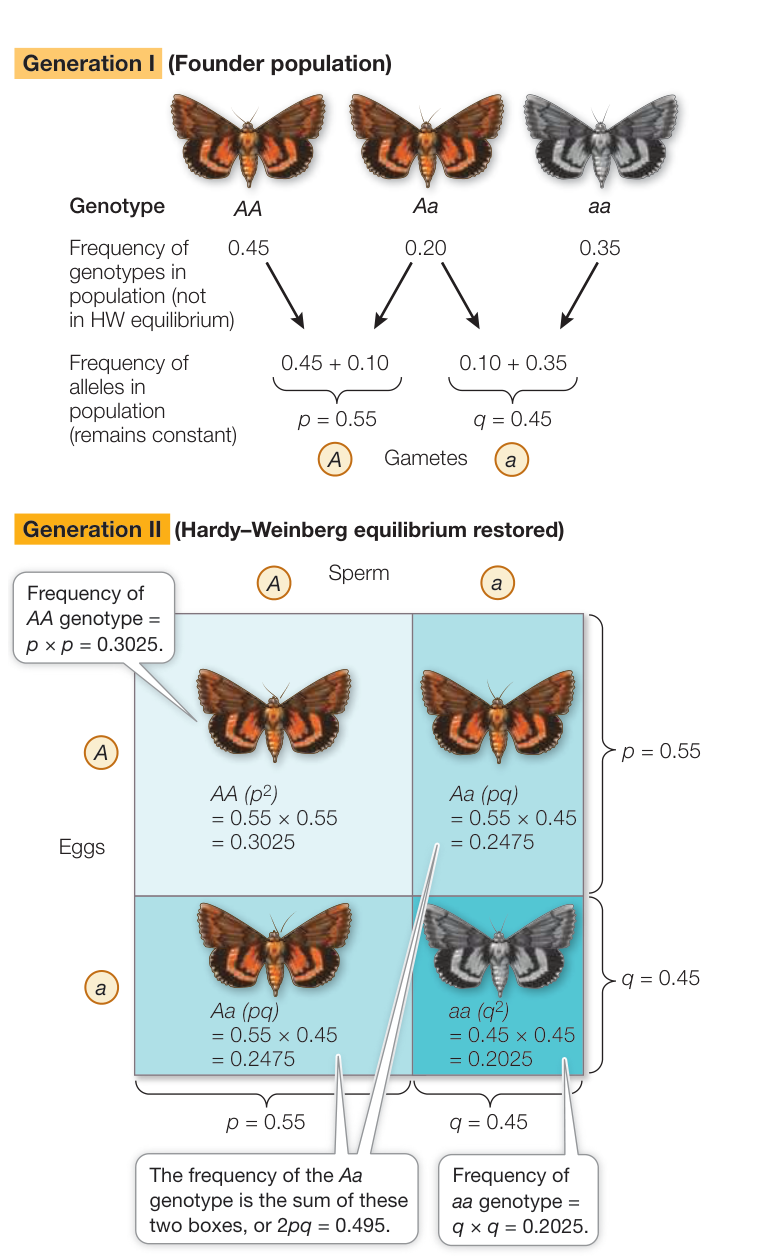
Figure 19.11 One Generation of Random Mating Restores Hardy–Weinberg Equilibrium Generation I of this population is made up of migrants from several source populations and so is not initially in Hardy–Weinberg equilibrium. After one generation of random mating, the allele frequencies are unchanged, and the genotype frequencies return to Hardy–Weinberg expectations. The lengths of the sides of each rectangle are proportional to the allele frequencies in the population; the areas of the rectangles are proportional to the genotype frequencies.
- There is no mutation. The alleles present in the population do not change, and no new alleles are added to the gene pool.
- There is no selection among genotypes. Individuals with different genotypes have equal probabilities of survival and equal rates of reproduction.
- There is no gene flow. There is no movement of individuals into or out of the population or reproductive contact with other populations.
- Population size is infinite. The larger a population, the smaller will be the effect of genetic drift.
- Mating is random. Individuals do not preferentially choose mates with certain genotypes.
If these idealized conditions hold, two major consequences follow. First, the frequencies of alleles at a locus remain constant from generation to generation. Second, following one generation of random mating, the genotype frequencies occur in the following proportions:
| Genotype | |||
|---|---|---|---|
| Frequency |
To understand why these consequences are important, start by considering a population that is not in Hardy–Weinberg equilibrium, such as generation I in Figure 19.11. This could occur, for example, if the initial population is founded by migrants from several other populations, thus violating the Hardy–Weinberg assumption of no gene flow. In this example, generation I has more homozygous individuals and fewer heterozygous individuals than would be expected under Hardy–Weinberg equilibrium (a condition known as heterozygote deficiency).
Even with a starting population that is not in Hardy–Weinberg equilibrium, we can predict that after a single generation of random mating, and if the other Hardy–Weinberg assumptions are not violated, the allele frequencies will remain unchanged, but the genotype frequencies will return to Hardy–Weinberg expectations. Let’s explore why this is true.
In generation I of Figure 19.11, the frequency of the allele () is 0.55. Because we assume that individuals select mates at random, without regard to their genotype, gametes carrying or combine at random—that is, as predicted by the allele frequencies and . Thus in this example the probability that a particular sperm or egg will bear an allele is 0.55. In other words, 55 out of 100 randomly sampled sperm or eggs will bear an allele. Because , the probability that a sperm or egg will bear an allele is .
To obtain the probability of two -bearing gametes coming together at fertilization, we multiply the two independent probabilities of their occurrence:
Therefore 0.3025, or 30.25%, of the offspring in generation II will have homozygous genotype . Similarly, the probability of two -bearing gametes coming together is
which means that 19.25% of generation II will have the genotype.
There are two ways of producing a heterozygote: an sperm may combine with an egg, the probability of which is ; or an sperm may combine with an egg, the probability of which is . Consequently, the overall probability of obtaining a heterozygote is , or 0.495. The frequencies of the , , and genotypes in generation II of Figure 19.11 now meet Hardy–Weinberg expectations, and the frequencies of the two alleles ( and ) have not changed from generation I.
Under the assumptions of Hardy–Weinberg equilibrium, allele frequencies and remain constant from generation to generation. If Hardy–Weinberg assumptions are violated and the genotype frequencies in the parental generation are altered (say, by the loss of a large number of individuals from the population), then the allele frequencies in the next generation will be altered. However, based on the new allele frequencies, another generation of random mating will be sufficient to restore the genotype frequencies to Hardy–Weinberg equilibrium.
Deviations from Hardy–Weinberg equilibrium show that evolution is occurring
You probably have realized that populations in nature never meet the stringent conditions necessary to be at Hardy–Weinberg equilibrium—which explains why all biological populations evolve. Why, then, is this model considered so important for the study of evolution? There are two reasons. First, the equation is useful for predicting the approximate genotype frequencies of a population from its allele frequencies. Second—and crucially—the model allows biologists to evaluate which processes are acting on the evolution of a particular population. The specific patterns of deviation from Hardy–Weinberg equilibrium can help us identify the various processes of evolutionary change.
Recap and Assess
Hardy–Weinberg equilibrium describes the theoretical conditions required for evolution not to occur. Deviations from Hardy–Weinberg expectations provide information about how evolution is occurring in a given population.
- The following sample lists the genotype at locus
for 10 individuals in a diploid population:
,
,
,
,
,
,
,
,
.
- Based on this sample, what is the observed frequency of allele ? The observed frequency of allele ?
- What are the observed frequencies of genotypes , , and ?
- After one generation of random mating, what would be the Hardy–Weinberg expectations for the frequencies of genotypes , , and ?
- In a population of toads, allele is present at a frequency of 0.2, and allele is present at a frequency of 0.8. Based on Hardy–Weinberg expectations, what is the expected frequency of the genotype in the population?
- Assume that the observed frequency of the genotype in the toad population in Question 2 is 0.15, rather than the expected frequency you calculated. What are some possible explanations?
Our discussion so far has focused on changes in allele frequencies at a single gene locus. Genes do not exist in isolation, however, but interact with one another (and with the environment) to produce an organism’s phenotype. What effects can these interactions have on selection?
Selection Can Be Stabilizing, Directional, or Disruptive
Learning Objectives
19.4.1 Describe the effect of each type of selection (stabilizing, directional, and disruptive) on phenotype evolution.
19.4.2 Distinguish conditions in which selection is likely to be stabilizing, directional, or disruptive.
Although evolution is defined as changes in the genetic makeup of a population from one generation to the next, natural selection acts directly on the phenotype—that is, on the physical features expressed by an organism with a given genotype—and therefore acts only indirectly on the genotype. The reproductive contribution of a phenotype to subsequent generations relative to the contributions of other phenotypes is called its fitness.
Changes in reproductive rate do not necessarily change the genetic structure of a population. For example, if all individuals in a population experience the same increase in reproductive rate (during an environmentally favorable year, for instance), the genetic structure of the population will not change. Changes in numbers of offspring are responsible for increases and decreases in the size of a population, but only changes in the relative success of different phenotypes in a population will lead to changes in allele frequencies from one generation to the next. The fitness of individuals of a particular phenotype is a function of the probability of those individuals surviving multiplied by the average number of offspring they produce over their lifetimes. In other words, the fitness of a phenotype is determined by the relative rates of survival and reproduction of individuals with that phenotype.
Until now, we have only discussed traits influenced by alleles at a single locus. Such traits are often distinguished by discrete qualities (black versus white, or smooth versus wrinkled) and so are called qualitative traits. Many traits, however, are influenced by alleles at more than one locus. Such traits are likely to show continuous quantitative variation rather than discrete qualitative variation, and so are known as quantitative traits. For example, body size is a continuous variable; the distribution of body sizes of individuals in a population, a trait that is influenced by genes at many loci as well as by the environment, is likely to resemble a continuous bell-shaped curve.
Natural selection can act on characters with quantitative variation in any one of several different ways, producing quite different results (Figure 19.12):
- Stabilizing selection preserves the average characteristics of a population by favoring average individuals.
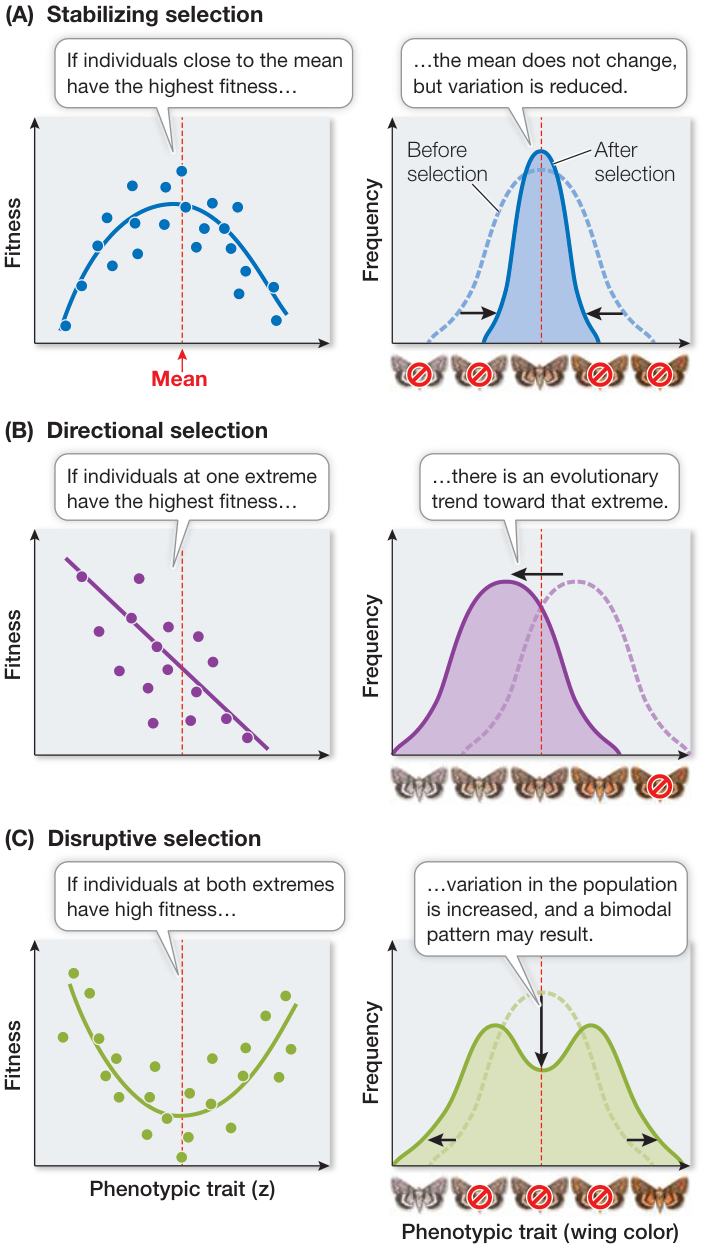
Figure 19.12 Natural Selection Can Operate in Several Ways The graphs in the left-hand column show the fitness of individuals with different phenotypes for the same character. The right-hand graphs show the distribution of the phenotypes in the population before (dashed line) and after (solid line) the influence of selection. Q: Why might selection for a trait in a population shift from directional to stabilizing selection over time, even if the optimal value for the trait stays constant?
- Directional selection changes the characteristics of a population by favoring individuals that vary in one direction from the mean of the population.
- Disruptive selection changes the characteristics of a population by favoring individuals that vary in both directions from the mean of the population.
Stabilizing selection reduces variation in populations
If the smallest and largest individuals in a population contribute fewer offspring to the next generation than do individuals closer to the average size, then stabilizing selection is operating on body size (see Figure 19.12A). Stabilizing selection reduces variation in populations, but it does not change the mean. Natural selection frequently acts in this way, countering increases in variation brought about by sexual recombination, mutation, or gene flow. Rates of phenotypic change in many species are slow because natural selection is often stabilizing. Stabilizing selection operates, for example, on human birth weight. Babies who are lighter or heavier at birth than the population mean die at higher rates than babies whose weights are close to the mean (Figure 19.13). In discussions of specific genes, stabilizing selection is often called purifying selection because there is selection against any deleterious mutations to the usual gene sequence.
Directional selection favors one extreme
Directional selection is operating when individuals at one extreme of a character distribution contribute more offspring to the next generation than other individuals do, shifting the average value of that character in the population toward that extreme. The opening story in this chapter describes directional selection for improved echolocation abilities in bats over time, and also directional selection for improved ultrasound hearing in their prey.
In the case of a single gene locus, directional selection may result in favoring a particular genetic variant—referred to as positive selection for that variant. By favoring one phenotype over another, directional selection results in an increase in the frequencies of alleles that produce the favored phenotype.
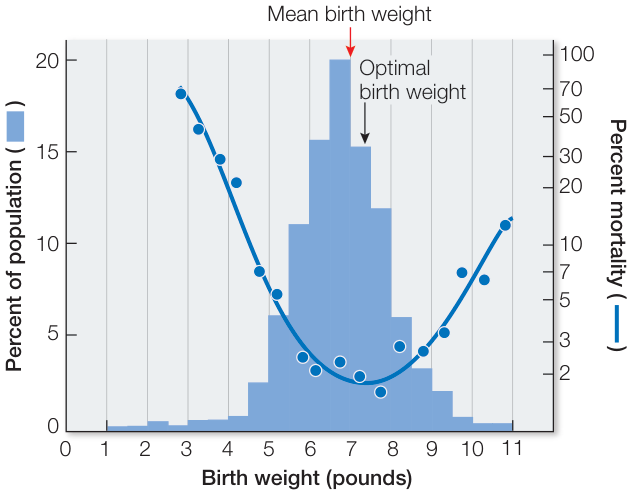
Figure 19.13 Human Birth Weight Is Influenced by Stabilizing Selection Babies that weigh more or less than average are more likely to die soon after birth than are babies with weights closer to the population mean. (After L. L. Cavalli-Sforza and W. F. Bodmer. 1971. The Genetics of Human Populations. W. H. Freeman and Company: San Francisco.)
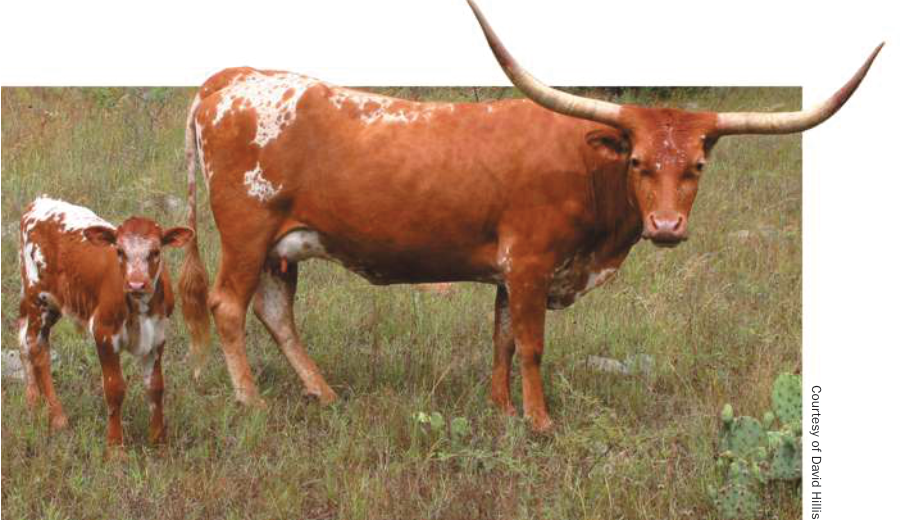
Figure 19.14 A Result of Directional Selection In the American Southwest, long horns were advantageous for defending calves from attacks by predators, so cows with longer horns were more likely to raise calves successfully. As a result, horn length in feral herds of cattle increased between the early 1500s and the 1860s, leading to the Texas Longhorn breed. This evolutionary trend has been maintained by modern ranchers practicing artificial selection.
If directional selection operates over many generations, an evolutionary trend is seen in the population (see Figure 19.12B). Evolutionary trends often continue for many generations, but they can be reversed if the environment changes and different phenotypes are favored, or halted when an optimal phenotype is reached or trade-offs between different adaptational advantages oppose further change. The character then undergoes stabilizing selection.
The long horns of Texas Longhorn cattle (Figure 19.14) are an example of a trait that has evolved through directional selection. Texas Longhorns are descendants of cattle brought to the New World by Christopher Columbus, who picked up a few cattle in the Canary Islands and brought them to the island of Hispaniola in 1493. The cattle multiplied, and their descendants were taken to the mainland of Mexico. Spaniards exploring what would become Texas and the southwestern United States brought these cattle with them, and some of them escaped and formed feral herds. Populations of feral cattle increased greatly over the next few hundred years, but there was heavy predation from bears, mountain lions, and wolves, especially on the young calves. Cows with longer horns were more successful in protecting their calves against attacks, and over a few hundred years the average horn length in the feral herds increased considerably. In addition, the cattle evolved resistance to endemic diseases of the Southwest, as well as higher fecundity and longevity. Texas Longhorns often live and produce calves well into their twenties—about twice as long as many breeds of cattle that have been artificially selected by humans for traits such as high fat content or high milk production (which are examples of artificial directional selection).
Disruptive selection favors extremes over the mean
When disruptive selection operates, individuals at opposite extremes of a character distribution contribute more offspring to the next generation than do individuals close to the mean, which increases variation in the population (see Figure 19.12C).
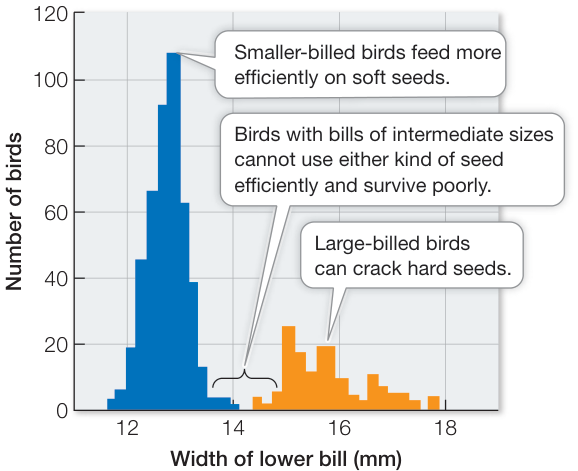
Figure 19.15 Disruptive Selection Results in a Bimodal Character Distribution The bimodal distribution of bill size in the black-bellied seedcracker (Pyrenestes ostrinus) of West Africa is a result of disruptive selection, which favors individuals with larger and smaller bill sizes over individuals with intermediate-sized bills. (After T. B. Smith. 1993. Nature 363: 618–620.)
The strikingly bimodal (two-peaked) distribution of bill size in the Black-bellied Seedcracker (Pyrenestes ostrinus), a West African finch (Figure 19.15), illustrates how disruptive selection can influence populations in nature. The seeds of two types of sedges (marsh plants) are the most abundant food source for these finches during part of the year. Birds with large bills can readily crack the hard seeds of the sedge Scleria verrucosa. Birds with small bills can crack S. verrucosa seeds only with difficulty; however, they feed more efficiently on the soft seeds of S. goossensii than do birds with larger bills. Young finches whose bills deviate markedly from the two predominant bill sizes do not survive as well as finches whose bills are close to one of the two sizes represented by the distribution peaks. Because there are few abundant food sources in the finches’ environment, and because the seeds of the two sedges do not overlap in hardness, birds with intermediate-sized bills are less efficient in using either one of the species’ principal food sources. Disruptive selection therefore maintains a bimodal bill size distribution.
Recap and Assess
Natural selection can both change and stabilize phenotypes within populations. Directional selection can result in continuous change to phenotypes; stabilizing selection slows change from a favored phenotype; and disruptive selection can result in one population that exhibits multiple distinct phenotypes.
- Describe the different expected outcomes of stabilizing, directional, and disruptive selection.
- Why would you expect selection on human birth weight to be stabilizing rather than directional?
- Offer some examples of extreme phenotypes in animal or plant populations that could be explained by directional selection.
Genetic drift, stabilizing selection, and directional selection all tend to reduce genetic variation within populations. Nevertheless, as we have seen, most populations harbor considerable genetic variation. What processes maintain genetic variation within populations?
Selection Can Maintain Variation within and among Populations
Learning Objectives
19.5.1 Explain how genetic variation is useful for a species in the face of environmental variability.
19.5.2 Describe how clinal variation within a species may be maintained through different selection pressures across the range of the species.
Genetic variation is the raw material on which mechanisms of evolution act. But if favored alleles increase in frequency in populations, then why aren’t other alleles always lost from the population? In this key concept we discuss some factors that affect how genetic variation is maintained within populations.
Frequency-dependent selection maintains genetic variation within populations
Natural selection often preserves variation as a polymorphism (the presence of two or more variants of a character in the same population). When the fitness of a given phenotype depends on its frequency in a population, a polymorphism may be maintained by a process known as frequency-dependent selection. Perissodus microlepis, a small fish that lives in Lake Tanganyika in East Africa, provides an example of frequency-dependent selection.
P. microlepis feeds on the scales of other fishes, approaching its prey from behind and dashing in to bite off several scales from the prey’s flank. Because of an asymmetrical jaw joint, the mouth of this scale-eating species opens either to the right or to the left; the direction is genetically determined (Figure 19.16). “Right-mouthed” individuals always attack from the victim’s left, and “left-mouthed” individuals always attack from the victim’s right. The distorted mouth enlarges the area of teeth in contact with the prey’s flank, but only if the scale-eater attacks from the appropriate side.
Prey fishes are alert to approaching scale-eaters, so attacks are more likely to be successful if the prey must watch both flanks. Vigilance by prey thus favors equal numbers of right-and left-mouthed scale-eaters in a population, because if attacks from one side were more common than the other, prey fishes would pay more attention to potential attacks from that side. Over an 11-year study of P. microlepis in Lake Tanganyika, the genetic polymorphism was found to be stable, and the two phenotypes of the scale-eaters remained at about equal frequencies.
Heterozygote advantage maintains polymorphic loci
In many cases, different alleles of a particular gene are advantageous under different environmental conditions. Most organisms experience a wide variety of environmental conditions over time. A night is dramatically different from the preceding day. A cold, cloudy day differs from a clear, hot one. Day length and temperature change seasonally. For many genes, a single allele is unlikely to perform well under all these conditions. In such cases, heterozygous individuals (with two different alleles) are likely to outperform homozygous individuals (with only one of those two alleles).
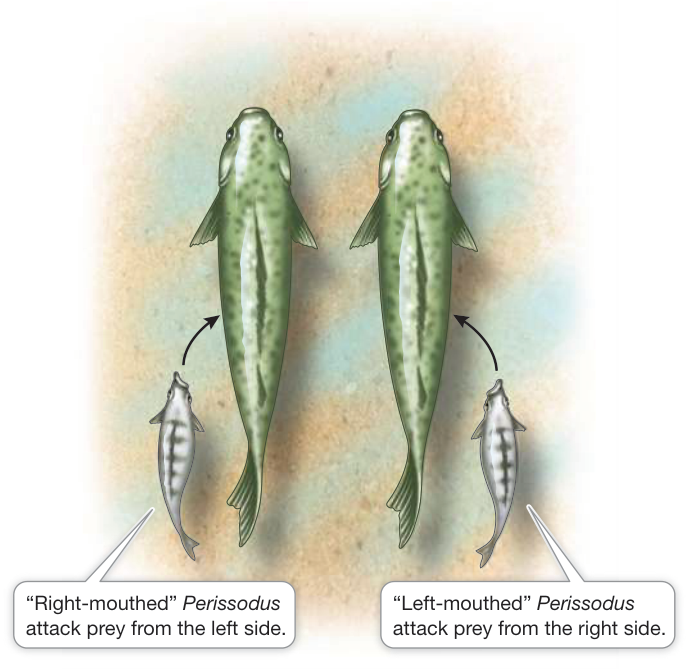
Figure 19.16 A Stable Polymorphism Frequency-dependent selection maintains equal proportions of left- and right-mouthed individuals of the scale-eating fish Perissodus microlepis.
Colias butterflies of the Rocky Mountains live in environments where dawn temperatures are often too cold, and afternoon temperatures too hot, for the butterflies to fly. Populations of these butterflies are polymorphic for a gene that encodes the enzyme phosphoglucose isomerase (PGI), which influences how well a butterfly flies at different temperatures. Butterflies with certain PGI genotypes can fly better during the cold hours of early morning; others perform better during midday heat. The optimal body temperature for flight is 35°C–39°C, but some butterflies can fly with body temperatures as low as 29°C or as high as 40°C. During spells of unusually hot weather, heat-tolerant genotypes are favored; during spells of unusually cool weather, cold-tolerant genotypes are favored.
Heterozygous Colias butterflies can fly over a greater range of temperatures than homozygous individuals, which should give them an advantage in foraging and finding mates. A test of this prediction found that heterozygous males did indeed have a mating advantage, and further, that this advantage maintains the polymorphism in the population (Figure 19.17). Of course, the heterozygous genotype can never become fixed in the population, because the offspring of two heterozygotes will always include both classes of homozygotes in addition to heterozygotes.
Genetic variation within species is maintained in geographically distinct populations
Much of the genetic variation within species is preserved as differences among members living in different places (populations). Populations often vary genetically because they are subjected to different selective pressures in different environments. Environmental conditions may vary significantly even over short distances. For example, in the Northern Hemisphere, temperature and soil moisture differ dramatically between north-and south-facing mountain slopes. In the Rocky Mountains of Colorado, the proportion of ponderosa pines (Pinus ponderosa) that are heterozygous for a particular peroxidase enzyme is particularly high on south-facing slopes, where temperatures fluctuate dramatically, often on a daily basis. This heterozygous genotype performs well over a broad range of temperatures. On north-facing slopes and at higher elevations, where temperatures are cooler and fluctuate less strikingly, a peroxidase homozygote, which has a lower optimal temperature, is much more frequent.
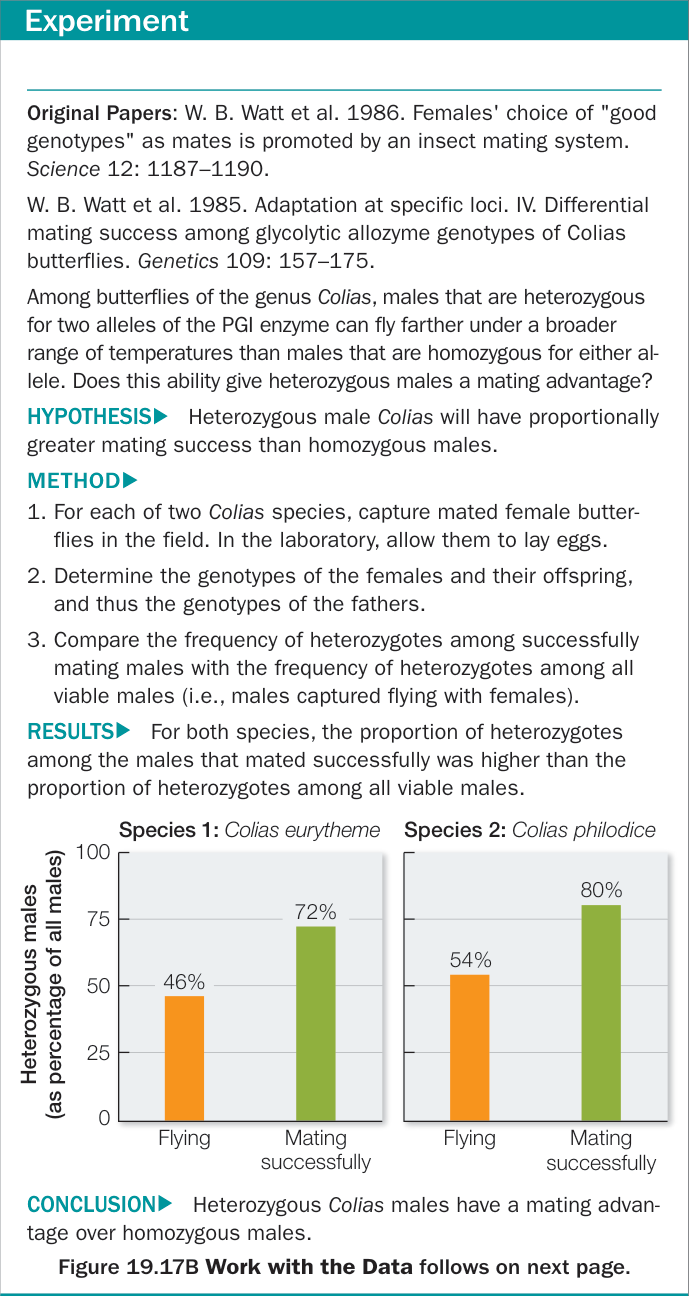
Figure 19.17A A Heterozygote Mating Advantage Figure 19.17A A Heterozygote Mating Advantage
Plant species may also vary geographically in the chemicals they synthesize to defend themselves against herbivores. Some individuals of the white clover (Trifolium repens) produce the poisonous chemical cyanide. Poisonous individuals are less appealing to herbivores—particularly mice and slugs—than are non-poisonous individuals. However, clover plants that produce cyanide are more likely to be killed by frost, because freezing damages cell membranes and releases cyanide into the plant’s own tissues.
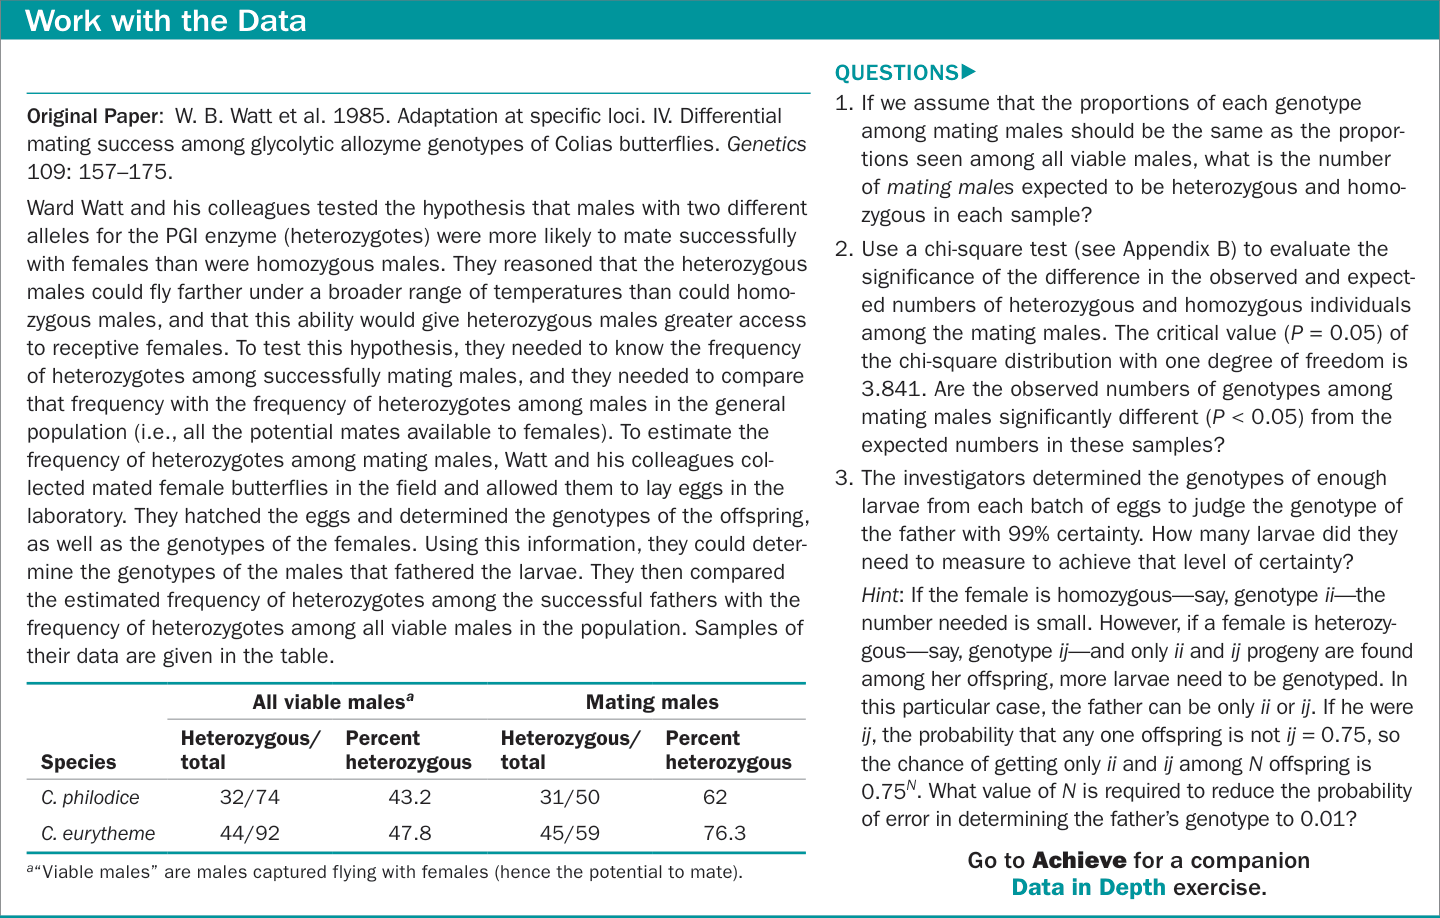
Figure 19.17B A Heterozygote Mating Advantage
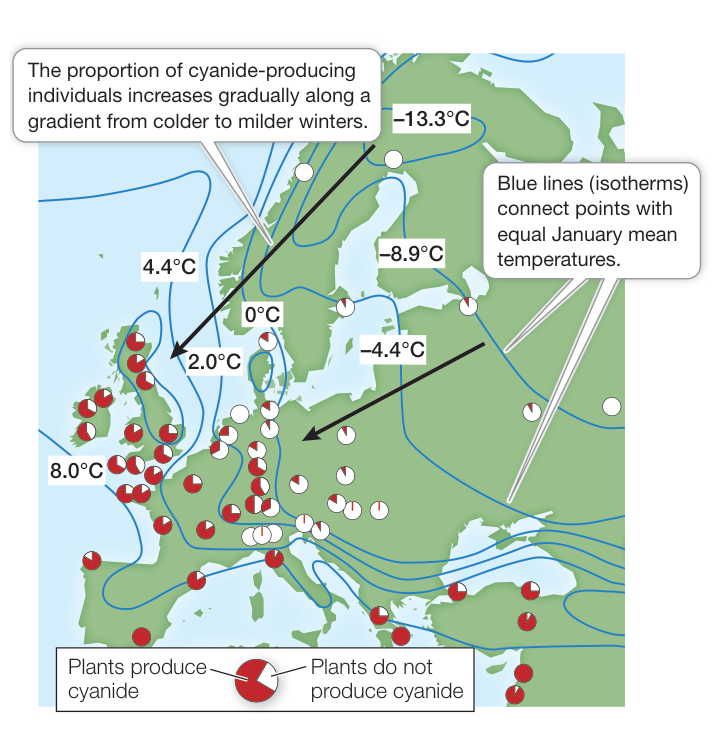
Figure 19.18 Geographic Variation in a Defensive Chemical The proportion of cyanide-producing individuals in European populations of white clover (Trifolium repens) depends on winter temperatures. (After H. Daday. 1956. Heredity 8: 61–78.)
In European populations of Trifolium repens, the frequency of cyanide-producing individuals increases gradually from north to south and from east to west (Figure 19.18). A pattern of gradual change in phenotype across a geographic gradient is known as clinal variation. In the white clover cline, poisonous plants make up a large proportion of populations only in areas where winters are mild. Cyanide-producing individuals are rare where winters are cold, even though herbivores graze clovers heavily in those areas.
Recap and Assess
Frequency-dependent selection and heterozygote advantage act to maintain considerable genetic variation in most populations. Variation within species is also maintained among geographically distinct populations.
- Human populations in central Africa have a high frequency of sickle-cell anemia, a genetic disorder that occurs in individuals who are homozygous for a particular allele of the hemoglobin gene. Despite strong selection against the homozygous sickle-cell condition, the sickle allele is maintained in relatively high frequencies in human populations that live in areas where malaria was historically common (compare the maps here;
figure source: F. B. Piel et al. 2010. Nat Commun 1: 104). Formulate a hypothesis that explains how this deleterious allele could be maintained in the population, even though individuals who are homozygous for the sickle allele are strongly disadvantaged.
Historic range of malaria in human populations
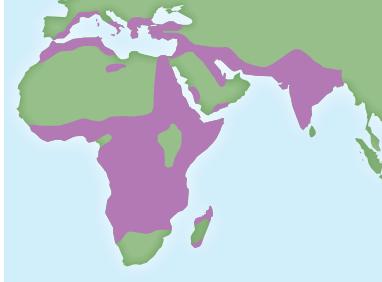
Distribution of sickle-cell allele
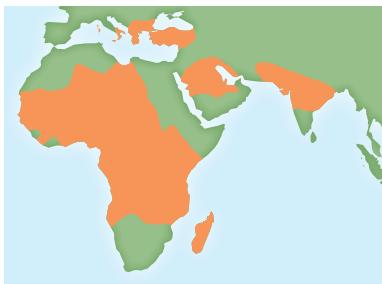
- How could you test the hypothesis that you formulated in your answer to Question 1?
- How could the presence of a great deal of genetic variation within a population increase the chances that some members of the population would survive an unprecedented environmental change? Why is there no guarantee that this would be the case?
The mechanisms of evolution have produced a remarkable variety of organisms. There are organisms that have adapted to nearly every environment on Earth. This natural variation, along with the success of breeders attempting to produce desired traits in domesticated plants and animals, suggests that evolution can produce a wide variety of adaptive traits. But are there limits to the adaptations evolution can produce?
Evolution Is Constrained by History and Trade-Offs
Learning Objectives
- 19.6.1 Describe how a preexisting trait or set of traits can limit the outcome of selection.
- 19.6.2 Give an example of an evolutionary trade-off.
- 19.6.3 Describe why short-term evolutionary outcomes may differ from long-term evolutionary outcomes.
We would be mistaken to assume that evolutionary mechanisms can produce any trait we might imagine. Evolution is constrained in many ways. Lack of appropriate genetic variation, for example, prevents the development of many potentially favorable traits. If the allele for a given trait does not exist in a population, that trait cannot evolve, even if it would be highly favored by natural selection. Most possible combinations of genes and genotypes have never existed in any population and so have never been tested under natural selection.
In addition, constraints are imposed on organisms by the dictates of physics and chemistry. The size of cells, for example, is constrained by the stringencies of surface area-to-volume ratios (see Figure 5.2). The ways in which proteins can fold are limited by the bonding capacities of their constituent molecules (see Key Concept 3.2). And the energy transfers that fuel life must operate within the laws of thermodynamics (see Key Concept 8.1). Keep in mind that evolution works within the boundaries of these universal constraints as well as the constraints described in this key concept.
Preexisting traits may constrain evolution
Evolutionary outcomes are often constrained because all evolutionary innovations are modifications of previously existing structures. Human engineers seeking to power an airplane can start “from scratch” to design a completely new type of engine (powered by jet propulsion) to replace the previous type (powered by propellers). Evolutionary changes, however, cannot happen in this way. Current phenotypes of organisms are constrained by historical conditions and past selective pressures.
A striking example of an evolutionary constraint is provided by the evolution of fishes that spend most of their time on the sea bottom, where a ventrally flattened body is advantageous. One such lineage, the bottom-dwelling skates and rays, shares a common ancestor with sharks, whose bodies are already somewhat ventrally flattened and whose skeletal frame is made of flexible cartilage. Skates and rays evolved a body type that further flattened their bellies, allowing them to swim along the ocean floor (Figure 19.19A).
By contrast, plaice, sole, and flounder are bottom-dwelling descendants of deep-bellied, laterally flattened ancestors with bony skeletons. The only way these fishes can lie flat is to flop over on their sides. Their ability to swim is thus curtailed, but their bodies can lie still and are well camouflaged. During development, one eye of these flatfishes moves so that both eyes are positioned on the same side of the body (Figure 19.19B). Such shifts in eye position have evolved several times, and shifts have happened in both directions (that is, both left-and right-eyed flatfishes have evolved independently). Small shifts in the position of one eye probably helped ancestral flatfishes see better, resulting in the body forms found today. This path to producing a flattened body may not be optimal, but the fishes’ developmental capabilities constrain the pathways that evolution can take.
Trade-offs balance costs and benefits
Adaptations frequently impose both costs and benefits. For an adaptation to be favored, the fitness benefits it confers must exceed the fitness costs it imposes—in other words, the trade-off must be worthwhile. For example, there are metabolic costs associated with developing and maintaining certain conspicuous features (such as antlers or horns) that males use to compete with other males for access to females. The fact that these features are common in many species suggests that the benefits derived from possessing them must outweigh the costs.
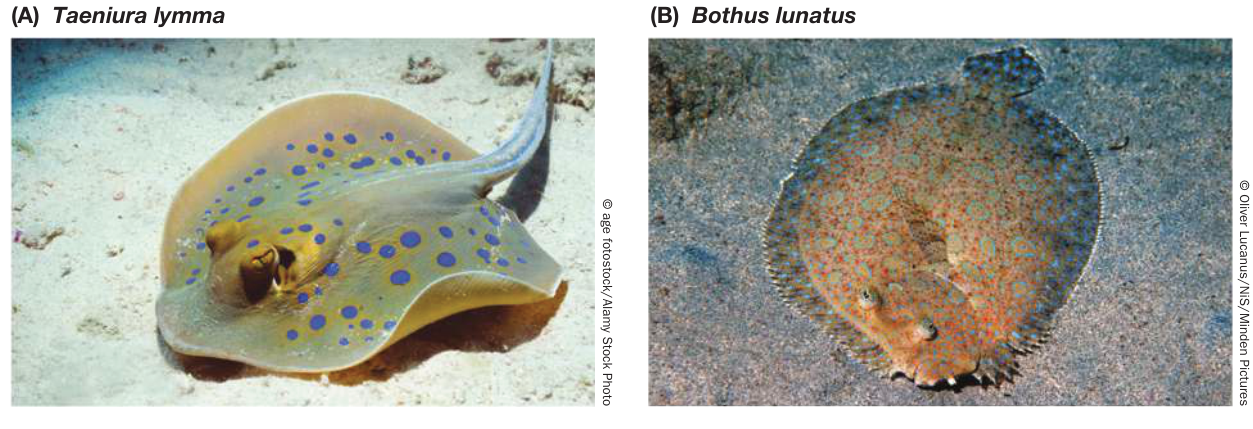
Figure 19.19 Two Solutions to a Single Problem (A) This stingray, whose ancestors were dorsoventrally flattened, lies on its belly. Stingrays’ bodies are symmetrical around the dorsal backbone. (B) This flounder, whose ancestors were laterally flattened, lies on its side. (The backbone of this individual is at the left.) Flounders’ eyes migrate during development so that both are on the same side of the body.
As a result of trade-offs, many traits that are adaptive in one context may be maladaptive in another. Consider the rough-skinned newt and one of its predators, the common garter snake (Figure 19.20A). The newt sequesters a potent neurotoxin called tetrodotoxin (TTX) in its skin. TTX paralyzes nerves and muscles by blocking sodium channels (see Key Concept 43.2). Most vertebrates—including many garter snakes—will die if they eat a rough-skinned newt. But some garter snakes can eat rough-skinned newts and survive: TTX-resistant sodium channels have evolved in the nerves and muscles of such individuals. However, for several hours after eating a newt, TTX-resistant snakes can move only slowly, and they never move as fast as nonresistant snakes. Resistant snakes are thus more vulnerable to their own predators than are TTX-sensitive snakes. This vulnerability leads to selection against TTX-resistant sodium channels in garter snake populations that occur outside the range of rough-skinned newts, even though there is selection for TTX resistance in many areas where newts are present (Figure 19.20B).
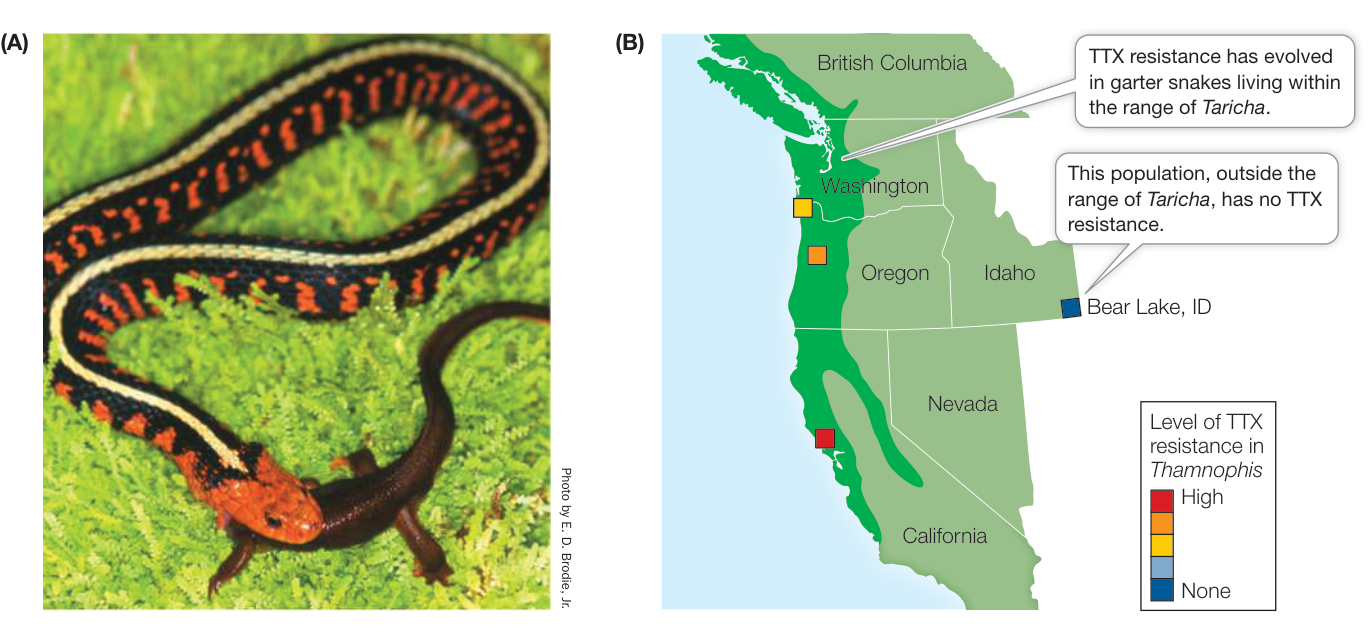
Figure 19.20 Resistance to a Toxin Comes at a Cost (A) Garter snakes (Thamnophis sirtalis) prey on rough-skinned newts (Taricha granulosa). Rough-skinned newts defend themselves by sequestering a neurotoxin, TTX, in their skin. In turn, TTX-resistant sodium channels have evolved in some snake populations, allowing the snakes to eat toxic newts but resulting in slower movement by the snakes. (B) High TTX resistance in garter snakes is found only in regions where snake and newt populations overlap (bright green area). (B after E. D. Brodie, III and E. D. Brodie, Jr. 1990. Evolution 44: 651–659.) Q: Why doesn’t TTX resistance spread throughout the range of the garter snake?
Short-term and long-term evolutionary outcomes sometimes differ
The short-term changes in allele frequencies within populations that we have emphasized in this chapter, often termed microevolutionary changes, are an important focus of study for evolutionary biologists. These changes can be observed directly, they can be manipulated experimentally, and they demonstrate the actual processes by which evolution occurs.
Long-term patterns of macroevolutionary change can also be strongly influenced by events that occur so infrequently (such as a meteorite impact) or so slowly (such as continental drift) that they are unlikely to be observed during short-term studies. The evolutionary mechanisms at work may change over time with changing environmental conditions. Even among the descendants of a single ancestral species, different lineages may evolve in different directions. Additional types of evidence—evidence demonstrating the effects of rare and unusual events on trends in the fossil record—must be gathered if we wish to understand the course of evolution over billions of years. We will consider these long-term aspects of evolution in the remaining chapters of Part 5.
Recap and Assess
Evolution is often constrained because all evolutionary innovations are modifications of previously existing structures. An adaptation can evolve only if the fitness benefits it confers exceed the fitness costs it imposes. The outcomes of short-term selection can be dramatically altered by events that occur over much longer periods of time.
- The largest living adult insects weigh less than 75 g (less than a relatively small songbird, such as a starling). Many flying birds are much larger than any insect, so clearly flight alone does not constrain the current size of insects. Formulate a hypothesis for why there are no giant insects presently roaming Earth.
- Natural selection results in gradual changes within species over long periods of time. Describe an event that could result in significant and sudden changes across many species simultaneously.
Investigating Life
Q&A How do complex traits such as echolocation, or the ability to avoid detection from echolocation, evolve in the first place? Future directions
In the opening story of this chapter, we discussed the evolutionary arms race between echolocating bats and the moths that evolved the ability to detect bat ultrasounds, and then avoid the predators. Moths are not the only potential bat prey that have evolved the ability to hear ultrasounds. Many other groups of insects can hear the sounds produced by bats, and act to avoid these predators. In many cases, the insects can already hear, as they have evolved complex communication systems to attract mates. This produces the natural variation in the trait (hearing) that is needed for natural selection to act.
As we learned in the experiment discussed in Investigating Life: Do Long Wing Tails Help Moths Escape Bat Predation?, many non-hearing insects have evolved other strategies for confusing or avoiding echolocating bats. Several species of moths have evolved long extensions of their wings, called wing tails. The wing tails flutter as the moths fly, and the fluttering wing tails serve to distract the echolocating bats. A bat that attacks the long wing tail of a moth may get nothing but a tiny piece of moth wing, while the moth survives the attack.
Some bats locate their prey using the sounds produced by the prey themselves. There are species of bats that locate prey by the sound of calling frogs, insects, or even the ripples made by fishes on the surface of the water. These prey species often must limit or modify the sounds they produce to balance the benefits of producing a sound with the costs associated with bat predation.
Species rarely evolve to a state of perfection and then stop evolving. Prey species are constantly evolving new ways to avoid predation, so predator species must evolve improved means of capturing prey. Although there are often historical, physiological, or mechanical limits to what can evolve, species are constantly changing in response to changes in their physical environment and species interactions. This constant selection for change, over millions or even billions of years, has produced the enormous diversity of life we see on Earth.
Future directions
Bats are not the only animals that have evolved the ability to echolocate. Toothed whales and dolphins, as well as some burrowing shrews and cave-dwelling birds, also use echolocation to “see” their environment with sound. So echolocation has evolved repeatedly in species that live in environments in which sight is limited. But how does a trait like echolocation first begin to evolve in a species? Some rudimentary form of the trait has to be present before selection can act to refine this sensory mode. Often, species co-opt a trait that evolved for other purposes, and then selection refines it over time for a new purpose.
Most humans do not use echolocation. We rely heavily on sight, and most of us feel awkward moving around unfamiliar spaces in the dark. But what would happen if humans were forced to live in an environment where we could not see? We already hear, of course, so we have a system that could be co-opted for echolocation. We are also capable of making sounds. Echolocation simply requires the production of sounds, the ability to detect the reflected sounds, and the ability to process the information appropriately. Indeed, some blind humans have trained themselves to use echolocation to sense their environment (see Media Clip 19.4). An individual learning a behavior is not the same as evolution of a behavior within a species, however. Before natural selection can act, there has to be genetic variation in the population for the trait in question. The fact that a few humans are able to use simple forms of echolocation shows that variation for this trait is already present in our species. The same is true for many species, which is why it is not surprising that echolocation has evolved multiple times in species that live or feed in the dark.
© blickwinkel/Alamy Stock Photo
You should be able to relate each summary to the adjacent figures. If you go to this visual summary in Achieve, you can follow links to figures, animations, activities, and simulations that will help you consolidate the material.
Visual Summary
Evolution Is Both Factual and the Basis of Broader Theory
- ■ Evolution is genetic change in populations over time. Evolution can be observed directly in living populations as well as in the fossil record of life.
- ■ Evolutionary theory refers to our understanding of the mechanisms of evolutionary change.
- ■ Charles Darwin is best known for his ideas on the common ancestry of divergent species and on natural selection (the differential survival and reproduction of individuals based on variation in their traits) as a mechanism of evolution.
Questions
- Explain the difference between “the fact of evolution” and what scientists mean by “evolutionary theory.”
- What did Darwin mean by “descent with modification”?
- How did Darwin suggest that biological evolution could occur?
Mutation, Selection, Gene Flow, Genetic Drift, and Nonrandom Mating Result in Evolution
- ■ Mutation is the source of the genetic variation on which the mechanisms of evolution act.
- ■ Within populations, selection acts to increase the frequency of beneficial alleles and to decrease the frequency of deleterious alleles.
- ■ Gene flow, genetic drift, and nonrandom mating (as arises from sexual selection) can also result in the evolution of populations.
Questions
- How does artificial selection differ from natural selection?
- How can genetic drift oppose the forces of natural selection?
- Why did Darwin distinguish the special case of sexual selection?
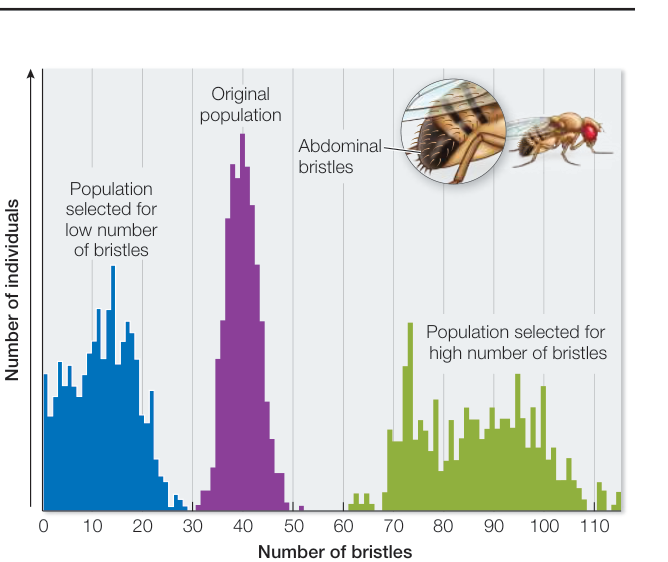
Figure 19.6
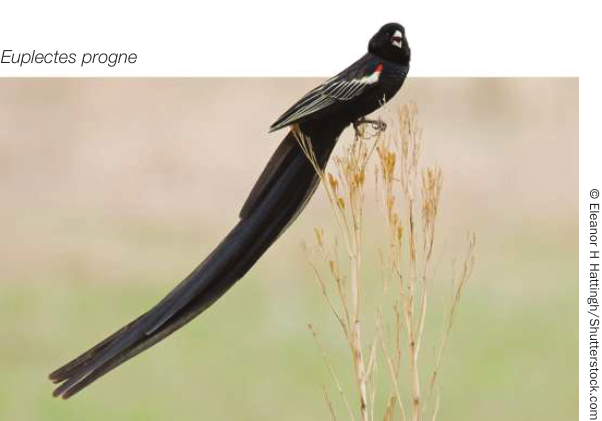
Figure 19.8
Evolution Can Be Measured by Changes in Allele Frequencies
- Allele frequencies measure the amount of genetic variation in a population. Genotype frequencies show how a population’s genetic variation is distributed among its members. Together, allele and genotype frequencies describe a population’s genetic structure.
- Hardy-Weinberg equilibrium predicts genotype frequencies from allele frequencies in the absence of evolution. Deviation from these frequencies indicates that evolutionary mechanisms are at work.
Questions
- How many generations of random mating are required to achieve Hardy-Weinberg equilibrium expectations?
- How do the assumptions of Hardy-Weinberg equilibrium correspond to the five principal processes of evolution?
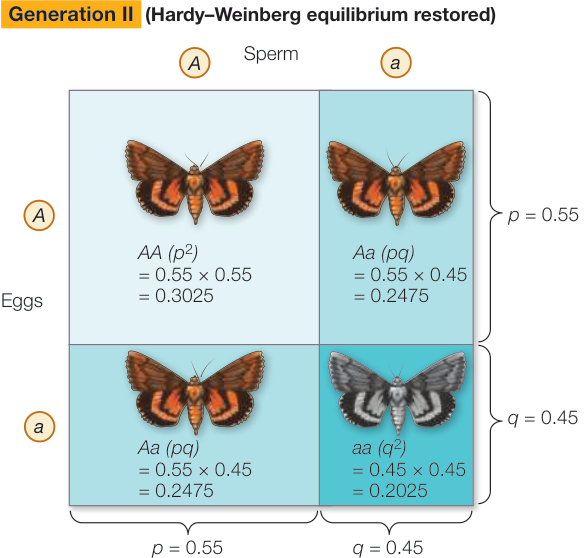
Figure 19.11
Selection Can Be Stabilizing, Directional, or Disruptive
- Stabilizing selection reduces variation without changing the mean value of a trait.
- Directional selection shifts the mean value of a trait toward one extreme.
- Disruptive selection favors both extremes of a trait value, resulting in a bimodal character distribution.
Question
- Which of the three types of selection (stabilizing, directional, or
disruptive) does each of the following cases represent?
- Higher survival and reproduction of giraffes with longer necks compared with those with shorter necks.
- Higher survival and reproduction of cattle with intermediate calf weights compared with those with high or low calf weights.
- Higher survival and reproduction of grasshoppers with either small or large mouthparts, compared with those with intermediate-sized mouthparts.
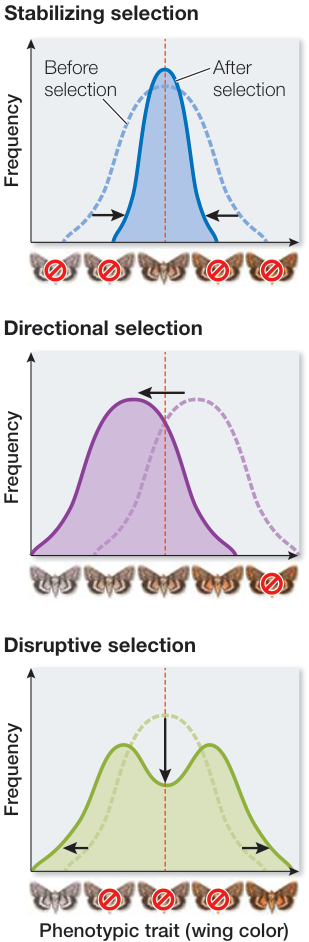
Figure 19.12
Selection Can Maintain Variation within and among Populations
- ■ A polymorphism may be maintained by frequency-dependent selection when the fitness of a genotype depends on its frequency in a population.
- ■ A polymorphism may also be maintained by heterozygote advantage when the fitness of the heterozygote exceeds the fitness of either homozygote.
- ■ Genetic variation within species may be maintained by the existence of genetically distinct populations over geographic space. A gradual change in phenotype across a geographic gradient is known as clinal variation.
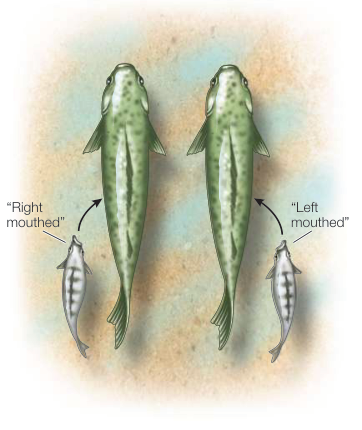
Figure 19.16
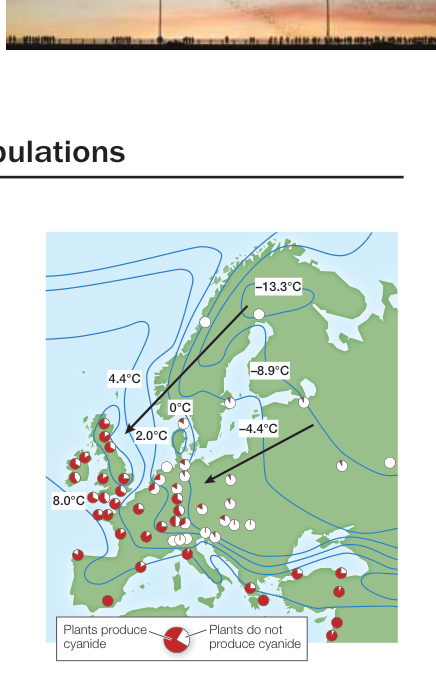
Figure 19.18
Question
- Which of the following are examples of frequency-dependent
selection, heterozygote advantage, or clinal variation?
- Increased sprinting performance of individuals with two different alleles of an actin gene, compared with individuals with two copies of just one of the alleles.
- Increased survival of individuals with rare color patterns, compared with those with common color patterns.
- Geographic variation in the size of deer from northern to southern latitudes.
Evolution Is Constrained by History and Trade-Offs
- ■ Evolutionary outcomes are often constrained because all evolutionary innovations are modifications of previously existing structures.
- ■ Most adaptations impose costs as well as benefits. An adaptation can evolve only if the benefits it confers exceed the costs it imposes.
Questions
- Why is flight more likely to evolve in some groups than in others? For example, why do you think there are no flying turtles?
- Why don’t all snakes that could potentially eat poisonous newts evolve resistance to their toxins?
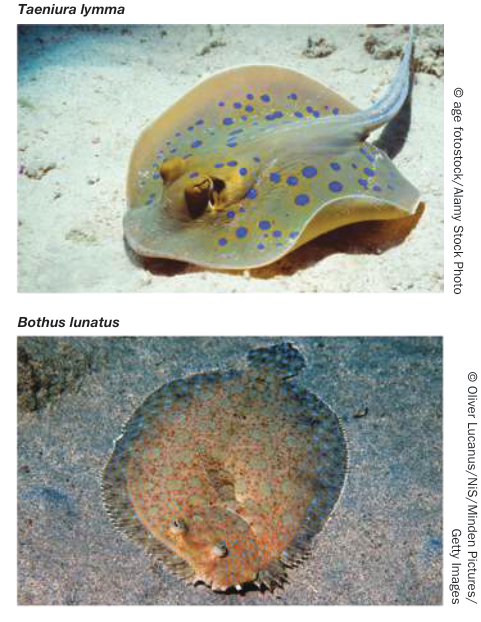
Figure 19.19
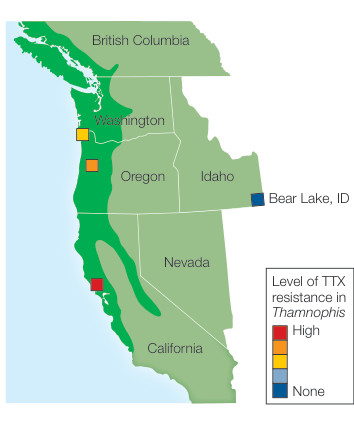
Figure 19.20