Chapter 23The History of Life on Earth
© Michael Matt/Alamy Stock Photo
Key Concepts
23.1 Events in Earth’s History Can Be Dated
23.2 Changes in Earth’s Physical Environment Have Affected the Evolution of Life
23.3 Major Events in the Evolution of Life Can Be Read in the Fossil Record
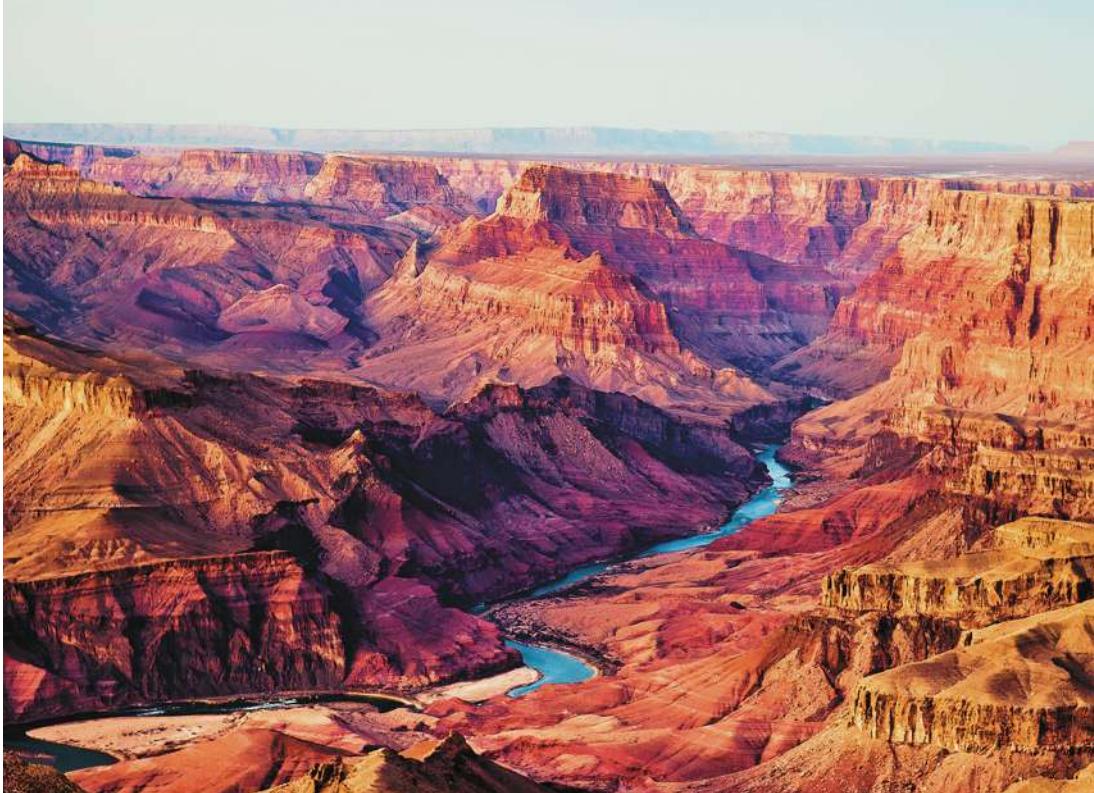
Layers of rocks in the Grand Canyon reveal almost 2 billion years of Earth’s history.
Investigating Life: When Giant Insects Ruled the Skies
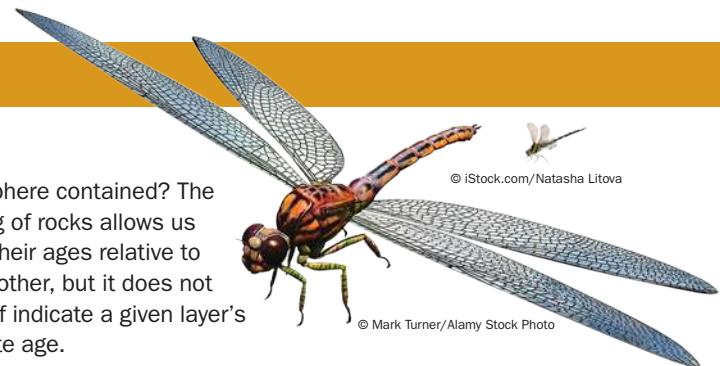
The largest dragonflies alive today have wingspans that can be covered by a human hand. Three hundred million years ago (mya), however, dragonflies such as Meganeuropsis permiana had wingspans of more than 70 centimeters—well over 2 feet, matching or exceeding the wingspans of many modern birds of prey. These dragonflies were the largest flying predators of their time. Shown here is an artist’s reconstruction of M. permiana is shown at the same scale as a modern dragonfly.
No flying insects alive today are anywhere near this size. But during the Carboniferous and Permian geological periods, 350 to 250 mya, many groups of flying insects contained gigantic species. Meganeuropsis probably ate huge mayflies and other giant flying insects that shared its home in the Permian swamps. These enormous insects were themselves eaten by giant amphibians. None of these insects or amphibians would be able to survive on Earth today. The oxygen concentrations in Earth’s atmosphere were about 50% higher than they are now, and those high oxygen concentrations are thought to have been necessary to support giant insects and their huge amphibian predators.
Paleontologists have uncovered fossils of Meganeuropsis permiana in the rocks of Kansas. How do we know the age of these fossils, and how can we know how much oxygen that long-vanished atmosphere contained? The layering of rocks allows us to tell their ages relative to one another, but it does not by itself indicate a given layer’s absolute age.
Scientists have developed sophisticated techniques that use the decay rates of radioisotopes, the ratios of certain molecules in rocks, and changes in Earth’s magnetic field to infer conditions and events in the remote past and to date them accurately. It is those methods that allow us to age the fossils of Meganeuropsis and to calculate the concentration of oxygen in Earth’s atmosphere at the time.
Earth is about 4.5 billion years old, and life has existed on it for about 3.8 billion of those years. That means human civilizations have occupied Earth for less than 0.0003% of the history of life. Discovering what happened before humans were around is an ongoing and exciting area of science.
Q&A How can modern experiments test hypotheses about the evolutionary impact of ancient environmental changes? (Find the answer on page 532.)
© iStock.com/Natasha Litova
© Mark Turner/Alamy Stock Photo
Events in Earth’s History Can Be Dated
Learning Objectives
- 23.1.1 Construct a geological map indicating the ages of exposed rocks and use the map to search for fossils of a given age.
- 23.1.2 Select appropriate methods for dating fossils and rocks from different geological time periods.
- 23.1.3 Place important events in biological history onto a time line of Earth’s history.
Some evolutionary changes happen rapidly enough to be studied directly and manipulated experimentally. Plant and animal breeding by agriculturalists and the evolution of surface proteins in influenza viruses are examples of rapid, short-term evolution that we have discussed in previous chapters. Such changes can take place in months, years, decades, or centuries. Other evolutionary changes, such as the appearance of new species and major evolutionary lineages, usually take place over much longer time scales.
To understand long-term patterns of evolutionary change, we must not only think in time scales spanning many millions of years, but also consider events and conditions very different from those we observe today. Earth of the distant past was so unlike our present Earth that it would seem like a foreign planet inhabited by strange organisms. The continents were not where they are now, and climates were sometimes dramatically different from those of today. We know this because much of Earth’s history is recorded in its rocks.
Geological strata tell us the relative ages of rocks
We cannot tell the ages of rocks just by looking at them, but we can visually determine the ages of rocks relative to one another. The first person to formally recognize this fact was the seventeenth-century Danish physician Nicolaus Steno. Steno realized that in undisturbed sedimentary rocks (rocks formed by the accumulation of sediments), the oldest layers of rock, or strata (singular stratum), lie at the bottom, and successively higher strata are progressively younger.
Geologists subsequently combined Steno’s insight with their observations of fossils contained in sedimentary rocks. They developed the following principles of stratigraphy (the study of geological strata):
- Fossils of similar organisms are found in widely separated places on Earth.
- Certain fossils are always found in younger strata, and certain other fossils are always found in older strata.
- Fossilized organisms found in younger strata are more similar to modern organisms than are those found in older strata.
These patterns revealed much about the relative ages of sedimentary rocks and the fossils they contain, as well as patterns in the evolution of life. But geologists still could not tell the actual, as opposed to the relative, ages of rocks. A method for absolute dating of rocks—that is, determining their actual age rather than just their age relative to one another—did not become available until after radioactivity was discovered at the beginning of the twentieth century.
Radioisotopes provide a way to date fossils and rocks
Radioactive isotopes of atoms—radioisotopes—decay in a predictable pattern over long periods. Over a specific time interval, known as a half-life, half of the atoms in a radioisotope decay to become a different isotope (Figure 23.1A). The use of this knowledge to date fossils and rocks is known as radiometric dating.
Connect the Concepts As noted in Key Concept 2.1, stable isotopes of the same element have the same number of protons but different numbers of neutrons. Radioisotopes, however, are not stable; they spontaneously give off energy in the form of alpha, beta, or gamma radiation, which transforms the original atom.
To use a radioisotope to date a past event, we must know or estimate the concentration of that isotope at the time of that event, and we must know the radioisotope’s half-life. In the case of carbon-14 (), a radioisotope of carbon, the production of new in the upper atmosphere—by the reaction of neutrons with nitrogen-14 ( , a stable isotope of nitrogen)—just balances the natural radioactive decay of into . Therefore the ratio of to the more common stable isotope of carbon, carbon-12 (), is relatively constant in living organisms and in their environment. As soon as an organism dies, however, it ceases to exchange carbon compounds with its environment. Its decaying is no longer replenished, and the ratio of to in its remains decreases over time. Paleontologists can use the ratio of to in fossil material to date fossils that are 60,000 years old or younger (and thus the sedimentary rocks that contain those fossils). If fossils are older than that, so little remains that the limits of detection using this particular isotope are reached.
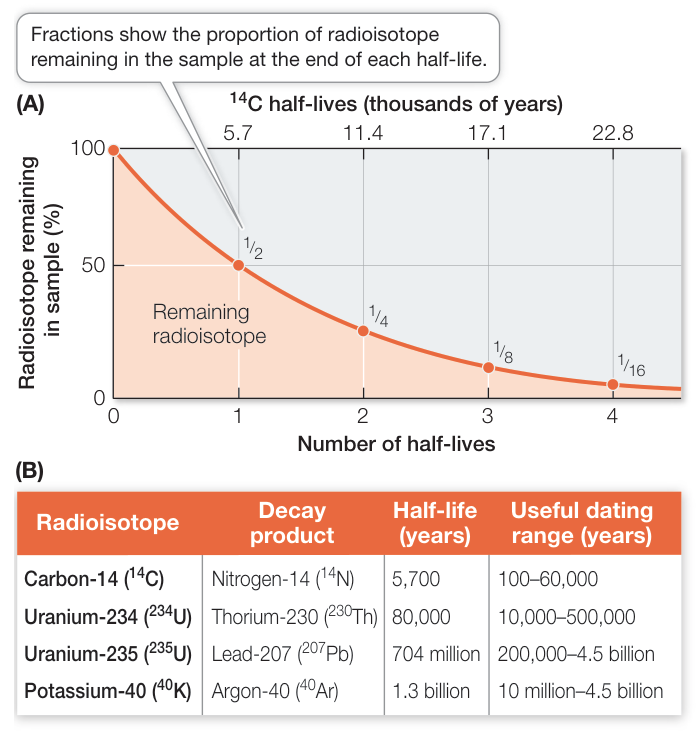
Figure 23.1 Radioactive Isotopes Allow Us to Date Ancient Rocks The decay of radioactive isotopes into stable isotopes happens at a steady rate. A half-life is the time it takes for half of the remaining atoms to decay in this way. (A) The graph demonstrates the principle of half-life using carbon-14 ( ) as an example. The half-life of is 5,700 years. (B) Different radioisotopes have different characteristic half-lives that allow us to estimate the ages of many rocks.
Radiometric dating methods have been expanded and refined
Sedimentary rocks are formed from materials that existed for varying lengths of time before being weathered, fragmented, and transported, sometimes over long distances, to the site of their deposition. Therefore the radioisotopes in sedimentary rock do not contain reliable information about the date of its formation. Radiometric dating of rocks older than 60,000 years requires estimating radioisotope concentrations in igneous rocks, which are formed when molten material cools. To date sedimentary strata, geologists search for places where volcanic ash or lava flows have intruded into the sedimentary rock.
A preliminary estimate of the age of an igneous rock determines which radioisotopes can be used to date it (Figure 23.1B). The decay of potassium-40 (which has a half-life of 1.3 billion years) to argon-40, for example, has been used to date many of the ancient events in the evolution of life. Fossils in the adjacent sedimentary rock that are similar to those in other rocks of known ages provide additional clues to the rock’s age.
Scientists have used several methods to construct a geological time scale
Radiometric dating of rocks, combined with fossil analysis, is the most powerful method of determining geological age. But in places where sedimentary rocks do not contain suitable igneous intrusions and few fossils are present, paleontologists turn to other dating methods.
One method, known as paleomagnetic dating, relates the ages of rocks to patterns in Earth’s magnetism, which change over time. Earth’s magnetic poles move and occasionally reverse themselves. Both sedimentary and igneous rocks preserve a record of Earth’s magnetic field at the time they were formed, and that record can be used to determine the ages of those rocks. Other dating methods use information about continental drift, information about sea level changes, and molecular clocks.
Connect the Concepts As Key Concept 20.3 explains, a molecular clock measures the average rate at which a given gene or protein product accumulates changes, and this rate of change can be used to deduce the geological time when two biological lineages diverged from one another.
Using all of these methods, geologists developed the geological time scale (Table 23.1). They divided the broad history of life into four eons. The Hadean refers to the time on Earth before life evolved. The early history of life occurred in the Archean, which ended about the time that photosynthetic organisms first appeared on Earth. Prokaryotic life diversified rapidly in the Proterozoic, and the first eukaryotes in the fossil record date from this time. These three eons are sometimes referred to collectively as Precambrian time, or simply the Precambrian. The Precambrian lasted for approximately 4 billion years and thus accounts for the vast majority of geological time. It was in the Phanerozoic, however—a mere 542-million-year time span—that multicellular eukaryotes rapidly diversified. To emphasize the events of the Phanerozoic, Table 23.1 shows the subdivision of this eon into eras and periods. The boundaries between these divisions of time are based largely on the striking differences geologists observe in the assemblages of fossil organisms contained in successive strata. This geological record of life reveals a remarkable story of a world in which the continents and biological communities are constantly changing.
Recap and Assess
The layering of sedimentary rock strata enables geologists to determine the relative ages of fossils. Assigning actual ages to these strata requires analysis of radioactive decay, paleomagnetic dating, and fossil comparisons across strata. Geologists divide the history of life into eons, eras, and periods based on assemblages of fossil organisms found in successive layers of rocks.
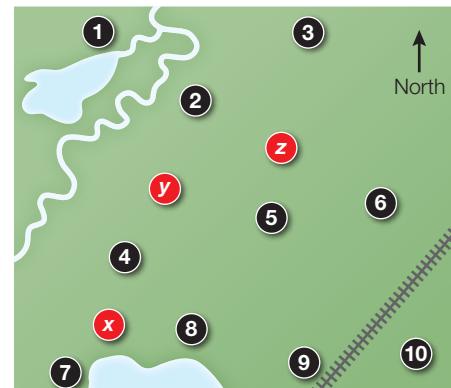
Imagine you have been assigned the job of producing a geological map of rocks that were formed between 600 and 400 mya. You collect a sample from each of ten sites (1–10 on the map), determine the ratio of lead-206 () to uranium-238 () for each sample, and use these ratios to estimate the ages of the rock samples. Your results are shown in the table.
| Site | ratio | Estimated age (mya) |
|---|---|---|
| 1 | 0.076 | 474 |
| 2 | 0.077 | 479 |
| 3 | 0.069 | 431 |
| 4 | 0.081 | 505 |
| 5 | 0.076 | 474 |
| 6 | 0.070 | 435 |
| 7 | 0.089 | 550 |
| 8 | 0.080 | 500 |
| 9 | 0.079 | 495 |
| 10 | 0.077 | 479 |
- Use this table and Table 23.1 to assign each sample to a geological period.
(Key Concept 23.1 Recap and Assess continues on page 517)
Table 23.1 Earth’s Geological History
| Eon | Era | Period | Onset a | Major physical changes on Earth | Major events in the history of life |
|---|---|---|---|---|---|
| Phanerozoic (~0.5 billion years long) | Cenozoic | Quaternary (Q) | 2.6 mya | Cold/dry climate; repeated glaciations | Humans evolve; many large mammals become extinct |
| Neogene (N) b | 23.0 mya | Continents near current positions; North and South America become connected | Considerable movement of plants and animals between North and South America through the Isthmus of Panama | ||
| Paleogene (Pg) b | 65.5 mya | Climate warms, then cools in response to changing CO 2 levels in Earth’s atmosphere | Diversification of major vertebrate groups, flowering plants, and insects following the mass extinction at the end of the Cretaceous | ||
| Mesozoic | Cretaceous (K) | 145.5 mya | Laurasian continents attached to one another; Gondwana begins to drift apart; meteorite strikes near current Yucatán Peninsula at end of period | Dinosaurs continue to diversify; mass extinction at end of period (~76% of species lost) | |
| Jurassic (J) | 201.6 mya | Two large continents form: Laurasia (north) and Gondwana (south); warm climate | Diverse dinosaurs; radiation of ray-finned fishes; first fossils of flowering plants | ||
| Triassic (Tr) | 251.0 mya | Pangaea begins to drift apart; hot/humid climate | Early dinosaurs; first mammals; marine invertebrates diversify; mass extinction at end of period (~65% of species lost) | ||
| Proterozoic | Paleozoic | Permian (P) | 299 mya | Extensive lowland swamps; O 2 levels 50% higher than present; by end of period continents aggregate to form Pangaea, and O 2 levels drop rapidly | Reptiles diversify; giant amphibians and flying insects present; mass extinction at end of period (~96% of species lost) |
| Carboniferous (C) | 359 mya | Climate cools; marked latitudinal climate gradients | Extensive fern/horsetail/giant club moss forests; first reptiles; insects diversify | ||
| Devonian (D) | 416 mya | Continents collide at end of period; giant meteorite probably strikes Earth | Jawed fishes diversify; first insects and amphibians; mass extinction at end of period (~75% of marine species lost) | ||
| Silurian (S) | 444 mya | Sea levels rise; two large land masses emerge; hot/humid climate | Jawless fishes diversify; first ray-finned fishes; plants and animals colonize land | ||
| Ordovician (O) | 488 mya | Massive glaciation; sea level drops 50 meters | Mass extinction at end of period (~75% of species lost) | ||
| Cambrian (C) | 542 mya | Atmospheric O 2 levels approach current levels | Rapid diversification of multicellular animals; diverse photosynthetic protists | ||
| Archean | Collectively called the Precambrian (~4 billion years long) | 2.5 bya | Atmospheric O 2 levels increase from negligible to about 18%; “snowball Earth” from about 750 to 580 mya | ||
| Hadean | 3.8 bya | Earth accumulates more atmosphere (still almost no O 2 ); meteorite impacts greatly reduced | Origin of life; prokaryotes flourish | ||
| 4.6–4.5 bya | Formation of Earth; cooling of Earth’s surface; atmosphere contains almost no free O 2 ; oceans form; Earth under almost continual bombardment from meteorites | Life not yet present |
amya, million years ago; bya, billion years ago.
bThe Neogene and Paleogene are often referred to as the Tertiary when discussed together.
(Key Concept 23.1 Recap and Assess continued)
- Use the estimated ages and geological periods of the ten samples to mark rough boundaries of the geological periods on the site map.
- If you wanted to refine the boundary between the Ordovician and Silurian on your map, which of three new sampling sites—x, y, or z—would you add to your analysis next?
- If you were interested in finding fossils of terrestrial plants or animals, where on this map would you concentrate your searches?
As geologists began to develop accurate ways to measure the age of Earth, they began to understand that Earth is far older than anyone had previously understood. During its 4.5-billion-year history, Earth has undergone massive physical changes. These changes have influenced the evolution of life, and life, in turn, has influenced Earth’s physical environment.
Changes in Earth’s Physical Environment Have Affected the Evolution of Life
Changes in Earth’s Physical Environment Have Affected the Evolution of Life
Learning Objectives
- 23.2.1 Characterize the relative impact of weather events and climate changes on Earth’s physical conditions.
- 23.2.2 Explain how the production of atmospheric oxygen has affected Earth and its living organisms.
- 23.2.3 Analyze the connections between a specific geological event or environmental change (e.g., fluctuations in ocean currents or sea levels, volcanic eruptions, meteorite strikes) and an evolutionary trend among living organisms.
As we saw in Key Concept 23.1, the Phanerozoic is notable for the rapid diversification of multicellular eukaryotes. The diversity of multicellular organisms has not, however, simply increased steadily through time. Throughout the history of life, new species have arisen while other species have become extinct. In the absence of major, rapid environmental changes, the average rate of extinction is known as the background extinction rate. But there have been times during which extinction rates have increased dramatically over the background levels (Figure 23.2). These mass extinction events, during which a large proportion of the species living at the time disappeared, are the cause of some of the striking differences in fossil assemblages that geologists use to divide the Phanerozoic into eras and periods. After each mass extinction, the diversity of life rebounded, although recovery took millions of years. Here we consider some of the physical changes on Earth that have resulted in dramatic changes in life’s diversity.
Earth’s continents have not always been where they are today
The globes and maps that adorn our walls, shelves, and books give an impression of a static Earth. It would be easy for us to assume that the continents have always been where they are. But we would be wrong. The idea that Earth’s land masses have changed their positions over the millennia, and that they continue to do so, was first put forth in 1912 by the German meteorologist and geophysicist Alfred Wegener. His idea, known as continental drift, was initially met with skepticism and resistance. By the 1960s, however, physical evidence and increased understanding of plate tectonics—the geophysics of the movement of major land masses—had convinced virtually all geologists of the reality of Wegener’s vision. Plate tectonics provided the geological mechanism that explained Wegener’s hypothesis of continental drift.
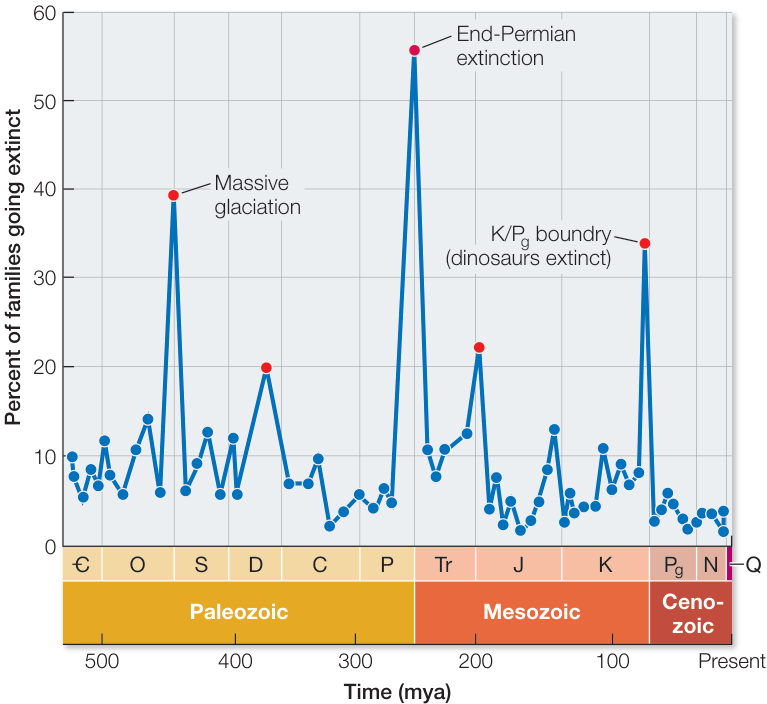
Figure 23.2 Periodic Mass Extinctions Mark Many Geologic Boundaries Five sharp rises (marked by red dots) above the background extinction rate have occurred throughout the Phanerozoic. The most sweeping of these events, the end-Permian extinction, was associated with dramatic drops in sea level (see Figure 23.4), global temperature, and atmospheric oxygen level (see Figure 23.8). (Data from D. M. Raup and J. J. Sepkoski, Jr. 1982. Science 215: 1501–1503.)
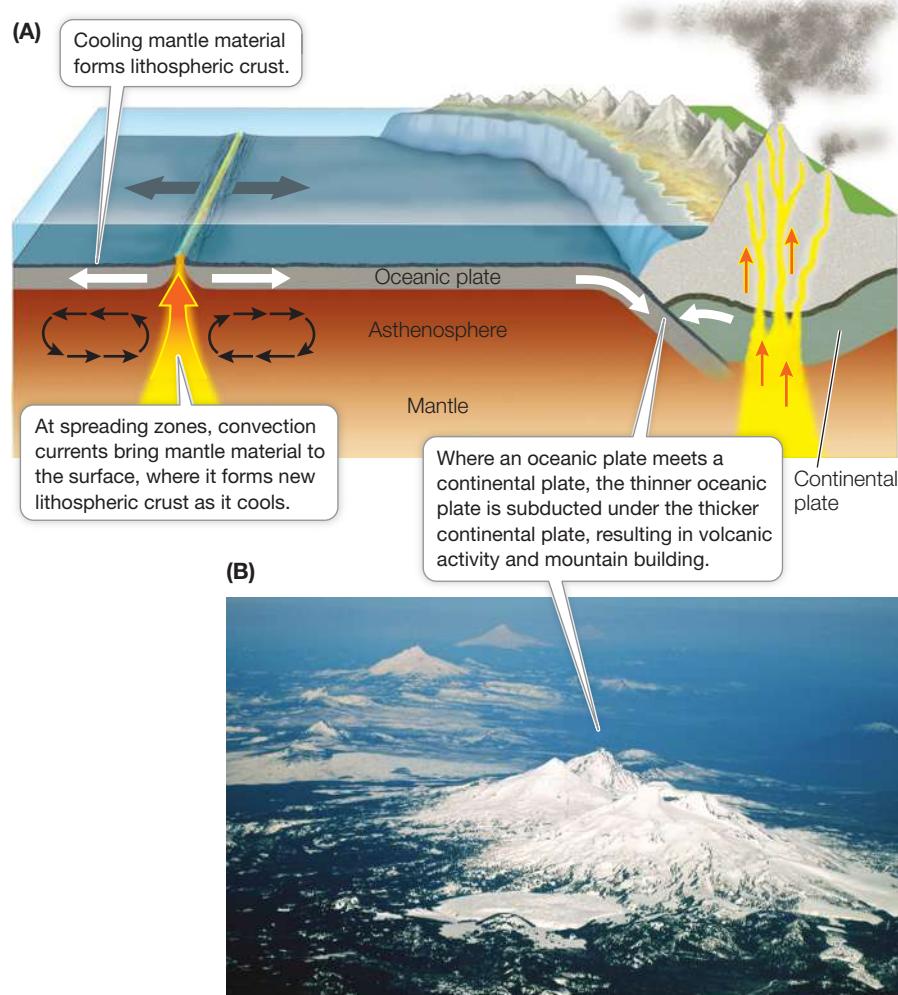
Earth’s crust consists of several solid plates, which collectively make up the solid lithosphere (“stone sphere”). Thick continental and thinner oceanic lithospheric plates overlie a more malleable layer of Earth’s mantle, known as the asthenosphere (“weak sphere”). Heat produced by radioactive decay deep in Earth’s core sets up large-scale convection currents in the mantle. New crust is formed as mantle material rises between diverging plates, pushing them apart.
Where oceanic plates and continental plates converge, the thinner oceanic plate is forced underneath the thicker continental plate, a process known as subduction. Subduction results in volcanism and mountain building on the continental boundary (Figure 23.3A). For example, in the Pacific Northwest of North America, a series of volcanoes formed the Cascade mountain range as the Juan de Fuca oceanic plate has been subducted beneath a portion of the continental North American Plate (Figure 23.3B). When two oceanic plates collide, one is also subducted below the other, producing a deep oceanic trench and associated volcanic activity. The deepest part of the world’s oceans—the Mariana Trench in the western Pacific—formed where two oceanic plates collided. Volcanic activity associated with the subduction at the Mariana Trench produced the nearby Mariana Islands.
When two thick continental plates collide, neither plate is subducted. Instead, the plates push up against one another, forming high mountain chains. The highest mountain chain in the world, the Himalayas, was formed this way when the Indian Plate collided with the Eurasian Plate. When continental plates diverge, new crust forms in the intervening spaces, resulting in deep clefts called rift valleys in which large freshwater lakes typically form. The Great Rift Valley lakes of eastern Africa, including Lake Malawi (discussed at the opening of Chapter 22), were formed in this way. Two plates can also slide past one another, forming a transform fault boundary (such as the San Andreas Fault that produces violent seismic activity in parts of California).
Many physical conditions on Earth have oscillated in response to plate tectonic processes. We now know that the movement of the plates has sometimes brought continents together and at other times has pushed them apart, as seen in the maps across the top of Figure 23.14. The positions and sizes of the continents influence oceanic circulation patterns, global climates, and sea levels. Sea levels are influenced directly by plate tectonic processes (which can influence the depth of ocean basins) and indirectly by oceanic circulation patterns, which affect patterns of glaciation. As climates cool, glaciers form and tie up water over land masses; as climates warm, glaciers melt and release water.
Earth’s climate has shifted between hot and cold conditions
Through much of Earth’s history, the climate was considerably warmer than it is today, and temperatures decreased more gradually toward the poles. At other times, Earth was colder than it is today. Rapid drops in sea levels throughout the history of Earth have resulted mainly from increased global glaciation (Figure 23.4). Many of these drops in sea level were accompanied by mass extinctions—particularly of marine organisms, which could not survive the disappearance of the shallow seas that covered vast areas of the continental shelves.
Earth’s cold periods were separated by long periods of milder climates. Because we are living in one of the colder periods, it is difficult for us to imagine the mild climates that were found at high latitudes in the past. The Quaternary, which began 2.6 mya and extends to the present, has been marked by a series of glacial advances, interspersed with warmer interglacial intervals during which the glaciers retreated.
“Weather” refers to the daily events at a given location, such as individual storms and the high and low temperatures on a given day. “Climate” refers to long-term average expectations over the various seasons at a given location. Weather often changes rapidly, whereas climates typically change slowly. However, major climate shifts have taken place over periods as short as 5,000 to 10,000 years, primarily as a result of changes in Earth’s orbit around the Sun. A few climate shifts have been even more rapid. For example, during one Quaternary interglacial period, the ice-locked Antarctic Ocean became nearly ice-free in less than 100 years. Some climate changes have been so rapid that the extinctions caused by them appear to be nearly instantaneous in the fossil record. Such rapid changes are usually caused by sudden shifts in ocean currents.
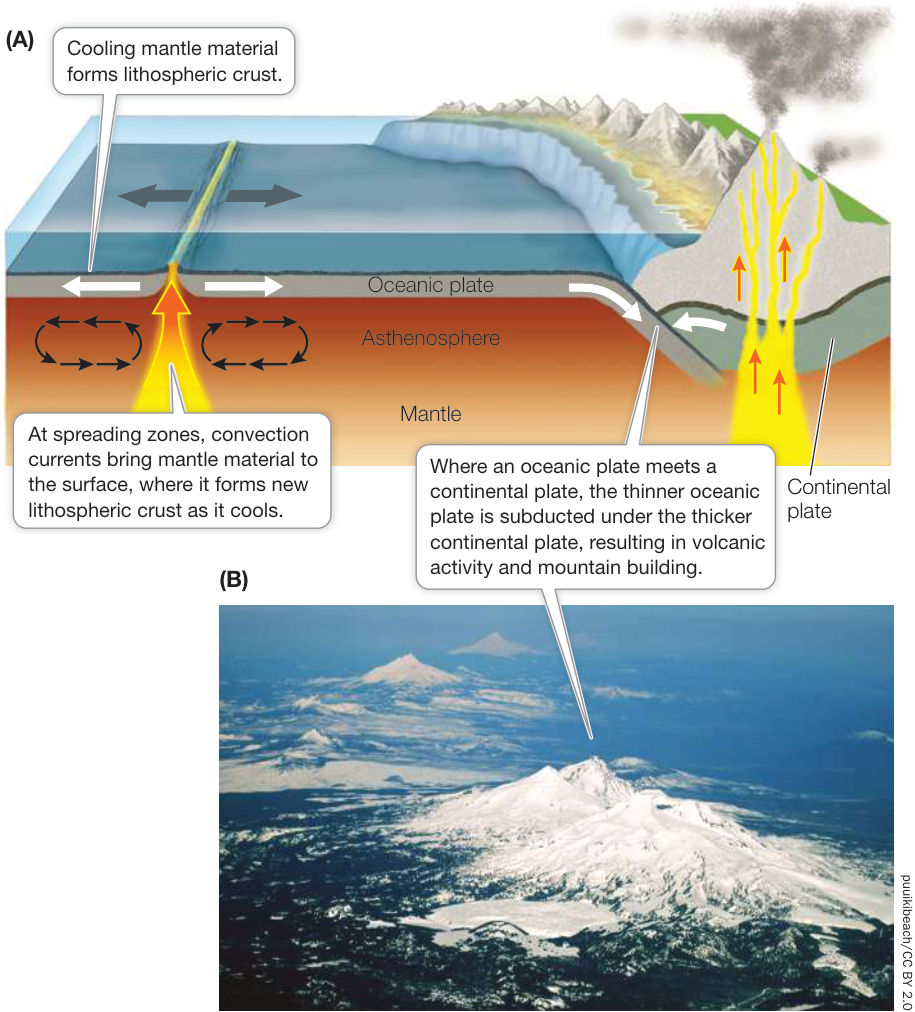
Figure 23.3 Plate Tectonics and Continental Drift (A) The heat of Earth’s core generates convection currents in the viscous mantle material underlying the oceanic and continental plates. Those currents push the continental plates, along with the land masses they carry, together or apart. Where plates collide, one may slide under the other, creating mountain ranges and often volcanoes. (B) The Cascade Range of the Pacific Northwest of North America is an example of a mountain chain produced by subduction of an oceanic plate under a continental plate. Q: Why are both shores of the Pacific Ocean ringed with volcanic mountain ranges?
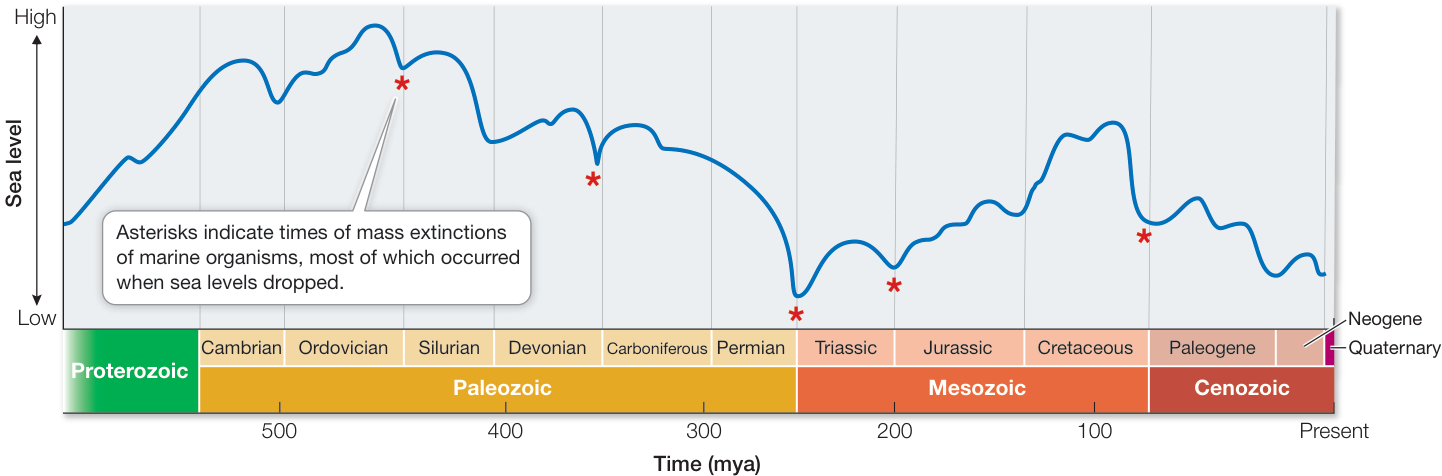
Figure 23.4 Sea Levels Have Changed Repeatedly Rapid drops in sea level are associated with periods of globally cooler temperatures and increased glaciation. Most mass extinctions of marine organisms have coincided with low sea levels. (After A. Hallum. 1984. Annu Rev Earth Planet Sci 12: 205–243.) Q: Why do cooler global temperatures result in lower sea levels?
We are currently living in a time of rapid climate change caused largely by a buildup of atmospheric CO2, primarily from the burning of fossil fuels by human populations. We are reversing the energy transformations accrued in the burial and decomposition of organic material that occurred (especially) in the Carboniferous, Permian, and Triassic, which gave rise to the fossil fuels we are using today. But we are burning these fuels over a few hundred years, rather than the many millions of years over which those deposits accumulated. The current rate of increase of atmospheric CO2 is unprecedented in Earth’s history. A doubling of the atmospheric CO2 concentration—which may happen during the current century—is expected to increase the average temperature of Earth, change rainfall patterns, melt glaciers and ice caps, and raise sea levels.
Connect the Concepts Today’s rapid climate changes are having an enormous effect on populations of many living organisms, as discussed in Key Concept 57.2.
Volcanoes have occasionally changed the history of life
Most volcanic eruptions produce only local or short-lived effects, but a few large volcanic eruptions have had major consequences for life. When Krakatau (a volcanic island in the Sunda Strait off Indonesia) erupted in 1883, it ejected more than 25 cubic kilometers of ash and rock as well as large quantities of sulfur dioxide gas (SO2). The SO2 was ejected into the stratosphere and carried by high-altitude winds around the planet. Its presence led to high concentrations of sulfurous acid (H2SO3) in high-altitude clouds, creating a “parasol effect” that resulted in less sunlight reaching Earth’s surface. Global temperatures dropped by 1.2 degrees Celsius in the year following the eruption, and global weather patterns showed strong effects for another 5 years. More recently, the eruption of Mount Pinatubo in the Philippines in 1991 (Figure 23.5) temporarily reduced global temperatures by about 0.5 degrees Celsius.
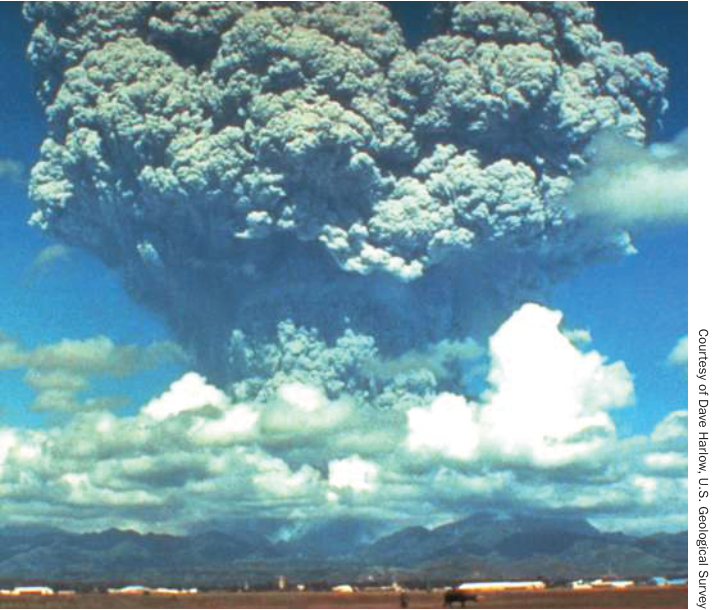
Figure 23.5 Volcanic Eruptions Can Cool Global Temperatures When Mount Pinatubo erupted in 1991, it increased the concentrations of sulfurous acid in high-altitude clouds, which temporarily lowered global temperatures by about 0.5 degrees Celsius.
Although these individual volcanoes had only relatively short-term effects on global temperatures, they suggest that the simultaneous eruption of many volcanoes could have a much stronger effect on Earth’s climate. What would cause many volcanoes to erupt at the same time? The collision of continents during the Permian, about 275 mya, formed a single, gigantic land mass and caused a multitude of massive volcanic eruptions as the continental plates overrode one another (see Figure 23.3). Emissions from these eruptions blocked considerable sunlight, contributing to the advance of glaciers and a consequent drop in sea levels (see Figure 23.4). Thus volcanic eruptions were probably responsible, at least in part, for the greatest mass extinction in Earth’s history.
Extraterrestrial events have triggered changes on Earth
Asteroids are large rocky bodies in orbit around the Sun. If an asteroid, or even a rock too small to be called an asteroid, collides with Earth and survives its passage through our atmosphere to hit the surface, then it is called a meteorite. At least 30 meteorites of sizes between tennis and soccer balls strike Earth each year. Collisions of larger meteorites or comets are rare, but such collisions have probably been responsible for several mass extinctions. Several types of evidence tell us about these collisions. Their craters, and the dramatically disfigured rocks that result from their impact, are found in many places. Geologists have discovered compounds in these rocks that contain helium and argon with isotope ratios characteristic of meteorites, which are very different from the ratios found elsewhere on Earth.
A meteorite impact from the Chicxulub asteroid, which was 10–15 kilometers in diameter, caused or contributed to a mass extinction at the end of the Cretaceous (about 65.5 mya). The first clue that a meteorite was responsible came from the abnormally high concentrations of the element iridium found in a thin layer separating rocks deposited during the Cretaceous from rocks deposited during the Paleogene (Figure 23.6). Iridium is abundant in some meteorites, but it is exceedingly rare on Earth’s surface. When scientists then discovered a circular crater 180 kilometers in diameter buried beneath the northern coast of the Yucatán Peninsula of Mexico, they constructed the following scenario. When it collided with Earth, the meteorite released energy equivalent to that of 100 million megatons of high explosives, creating great tsunamis. A massive plume of debris rose into the atmosphere, spread around Earth, and descended. The descending debris heated the atmosphere to several hundred degrees and ignited massive fires. It also blocked the Sun, preventing plants from photosynthesizing. The settling debris formed the iridium-rich layer. About a billion tons of soot with a composition matching that of smoke from forest fires was also deposited. These events had devastating effects on biodiversity. Many fossil species (including non-avian dinosaurs) that are found in Cretaceous rocks are not found in the overlying Paleogene rocks.
Oxygen concentrations in Earth’s atmosphere have changed over time
As the continents have moved over Earth’s surface, the world has experienced other physical changes, including large increases and decreases in atmospheric oxygen concentrations. The atmosphere of early Earth probably contained little or no free oxygen gas (). The increase in atmospheric came in two big steps more than a billion years apart.
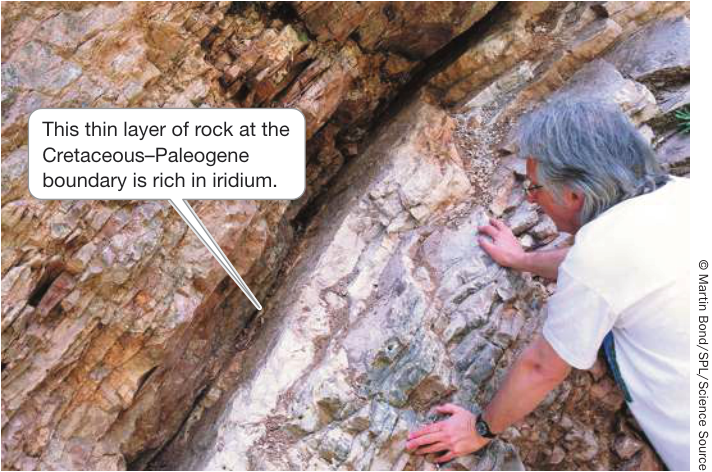
Figure 23.6 Evidence of a Meteorite Impact The white layers of rock are Cretaceous in age, whereas the layers at the upper left were deposited in the Paleogene. Between the two is a thin, dark layer of clay that contains large amounts of iridium, a metal common in some meteorites but rare on Earth. Its high concentration in this sediment layer, deposited about 65.5 million years ago, suggests the impact of a large meteorite at that time.
Oxygenation of Earth’s atmosphere began about 2.5 billion years ago (bya), when the ancestors of modern cyanobacteria evolved the ability to use water as the source of hydrogen ions for photosynthesis. By chemically splitting , these bacteria generated as a waste product. They also made electrons available for reducing
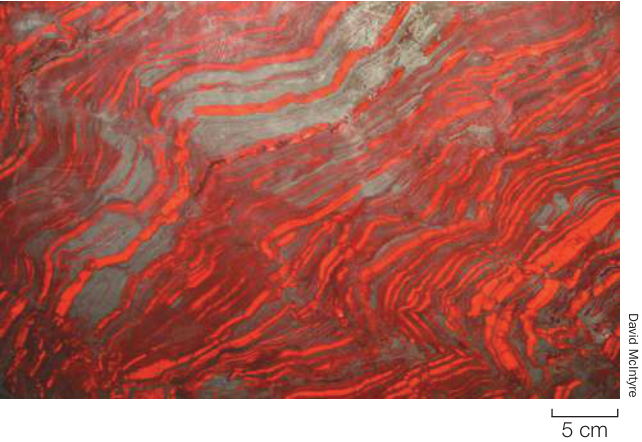
Figure 23.7 Banded Iron Formations Indicate Early Photosynthesis The alternating red and dark layers in this 2.25-billion-year-old sedimentary rock formation from Lake Superior resulted from a reaction between dissolved iron and the atmospheric oxygen produced by Earth’s first photosynthetic organisms. The chemical reaction produced nearly pure iron oxide, or hematite, which forms the gray, metallic layers in this sample. The red bands are jasper tinged with much smaller amounts of iron oxide.
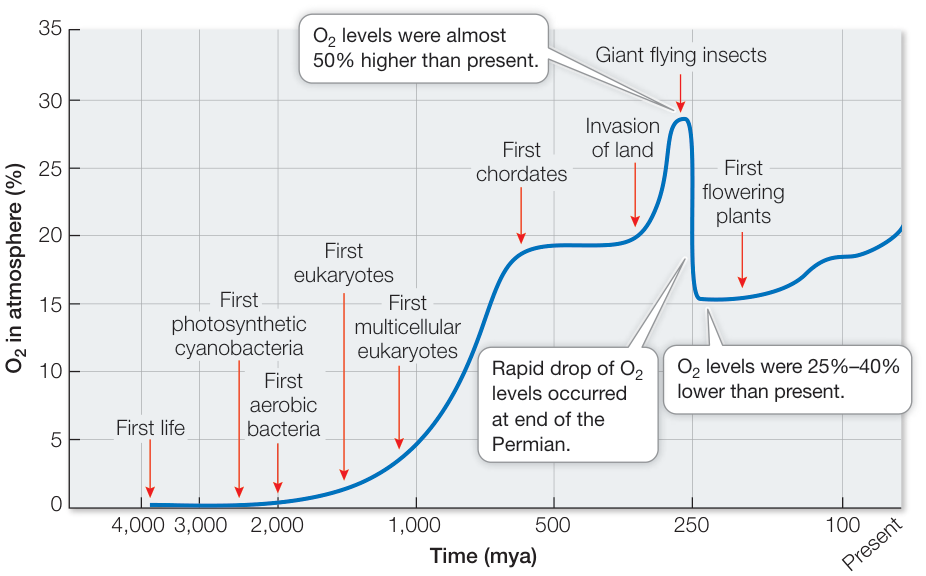
Figure 23.8 Atmospheric Oxygen Concentrations Have Changed over Time Changes in atmospheric oxygen concentrations have strongly influenced, and have been influenced by, the evolution of life. (Note that the horizontal axis of the graph is on a logarithmic scale.) (Data from R. A. Berner. 2006. Geochimica et Cosmochimica Acta 70: 5653–5664; R. Frei et al. 2009. Nature 461: 250–253.) Q: Why did oxygen levels decrease at the end of the Permian?
CO2 to form the carbohydrate end-products of photosynthesis (see Key Concept 10.3). The O2 they produced dissolved in water and reacted with dissolved iron. The reaction product then precipitated as iron oxide, which accumulated in alternating layers of red and dark rock known as banded iron formations (Figure 23.7). These formations provide evidence for the earliest photosynthetic organisms.
As photosynthetic organisms continued to release O2, oxygen gas began to accumulate in the atmosphere.
The second step occurred about a billion years later, when some of these photosynthetic bacteria became symbiotic within eukaryotic cells, leading to the evolution of chloroplasts in photosynthetic plants and other eukaryotes. This change resulted in continued accumulation of O2 in Earth’s atmosphere (Figure 23.8).
One group of O2-generating bacteria, the cyanobacteria, were a major component of complex communities that formed rocklike structures called stromatolites, which are abundantly preserved in the fossil record. To this day, cyanobacteria still form stromatolites in a few very salty places (Figure 23.9). Cyanobacteria liberated enough O2 to open the way for the evolution of oxidation reactions as the energy source for the synthesis of ATP.
As oxygen increased in the atmosphere, ultraviolet radiation from the Sun began to produce increased concentrations of ozone (O3) in the stratosphere, 20–30 kilometers above Earth’s surface. This ozone layer absorbs much of the Sun’s damaging ultraviolet radiation and prevents it from reaching Earth’s surface, which allowed expansion of life on land.
Thus the evolution of life irrevocably changed the physical nature of Earth. Those physical changes, in turn, influenced the evolution of life. When it first appeared in the atmosphere, O2 was toxic to most of the anaerobic prokaryotes that inhabited Earth at the time.
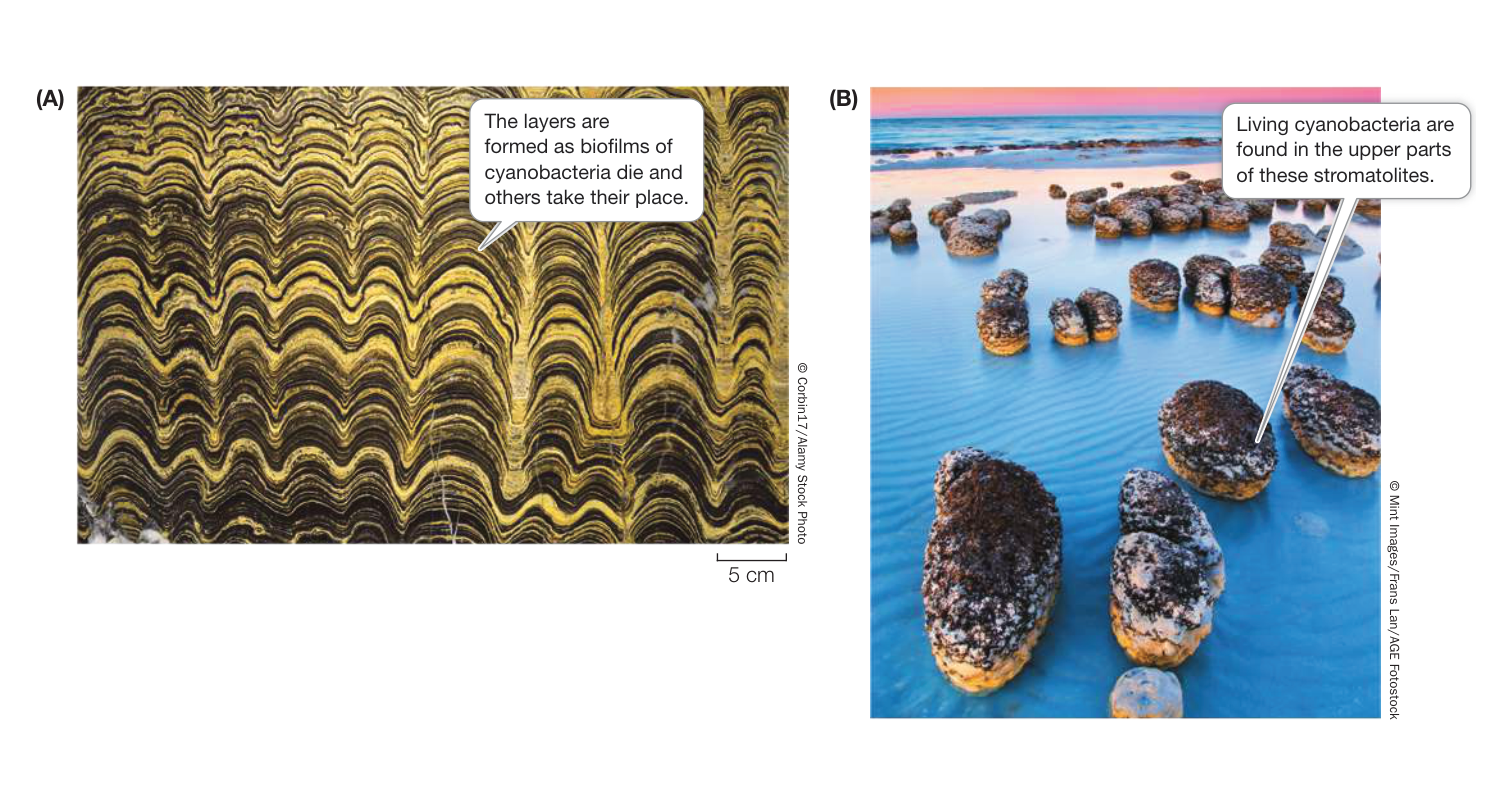
Figure 23.9 Stromatolites (A) A vertical section through a fossil stromatolite. (B) These rocklike structures are living stromatolites that thrive in the very salty waters of Shark Bay in Western Australia.
Over millennia, however, prokaryotes that evolved the ability to tolerate and use not only survived but gained the advantage. Aerobic metabolism proceeds more rapidly, and harvests energy more efficiently, than anaerobic metabolism. Organisms with aerobic metabolism replaced anaerobes in most of Earth’s environments.
An atmosphere rich in also made possible larger and more complex organisms. Small single-celled aquatic organisms can obtain enough oxygen by simple diffusion even when dissolved oxygen concentrations in the water are very low. Larger single-celled organisms, however, have lower surface area-to-volume ratios. To obtain enough oxygen by simple diffusion, larger organisms must live in an environment with a relatively high oxygen concentration. Bacteria can thrive at 1% of the current oxygen concentration, but eukaryotic cells require levels that are at least 2%–3% of the current concentration. For concentrations of dissolved oxygen in the oceans to have reached these levels, much higher atmospheric concentrations were needed.
Probably because it took many millions of years for Earth to develop an oxygenated atmosphere, only single-celled prokaryotes lived on Earth for more than 2 billion years. About 1.5 billion years ago, atmospheric concentrations became high enough for larger eukaryotic cells to flourish (see Figure 23.8). Further increases in atmospheric concentrations in the late Precambrian enabled several groups of multicellular eukaryotes to evolve and diversify.
Oxygen concentrations increased again during the Carboniferous and Permian because of the evolution of large vascular plants. These plants lived in the expansive lowland swamps that existed at the time (see Table 23.1). Massive amounts of organic material were buried in these swamps as the plants died, leading to the formation of Earth’s vast coal deposits. Because the buried organic material was not subject to oxidation as it decomposed, and because the living plants were producing large quantities of , atmospheric increased to concentrations that have not been reached again in Earth’s history (see Figure 23.8). As mentioned at the opening of this chapter, these high concentrations of atmospheric allowed the evolution of giant flying insects and large amphibians that could not survive in today’s atmosphere.
The drying of the lowland swamps at the end of the Permian reduced the burial of organic matter as well as the production of , so atmospheric concentrations dropped rapidly. Over the past 200 million years, with the diversification of flowering plants, concentrations have again increased, but not to the levels that characterized the Carboniferous and Permian.
Biologists have conducted experiments that demonstrate the changing selection pressures that can accompany changes in atmospheric concentrations. When fruit flies (Drosophila melanogaster) are raised in hyperoxic conditions (i.e., with artificially increased atmospheric concentrations of ), they evolve larger body sizes in just a few generations (Investigating Life: The Relationship between Atmospheric Oxygen Concentration and Body Size in Insects). The present atmospheric concentrations
▶ Investigating LIFE The Relationship between Atmospheric Oxygen Concentration and Body Size in Insects
Experiment
Original Paper: C. J. Klok et al. 2009. Single and multigenerational responses of body mass to atmospheric oxygen concentration in Drosophila melanogaster: Evidence for roles of plasticity and evolution. J Evol Biol 22: 2496–2504.
C. Jaco Klok and his colleagues asked whether insects raised in hyperoxic conditions (i.e., in an atmosphere having a higher partial pressure of oxygen than is normal today) would evolve to be larger than their counterparts raised under today’s atmospheric conditions. They raised strains of fruit flies (Drosophila melanogaster) under both conditions to test the effects of increased concentrations on the evolution of body size.
HYPOTHESIS In hyperoxic conditions, increased partial pressure of oxygen results in evolution of increased body size in flying insects.
METHOD
Separate a population of fruit flies into multiple lineages.
Raise half the lineages in current atmospheric (control) conditions; raise the other lineages in hyperoxic (experimental) conditions. Continue all lineages for seven generations.
Raise the individuals of all lineages under identical (current) atmospheric conditions.
- Weigh 50 flies from each of the replicate lineages and test for statistical differences in body weight.
RESULTS The average body mass of individuals of both sexes raised under hyperoxic conditions was significantly () greater than that of individuals in the control lineages. Error bars indicate 95% confidence limits.
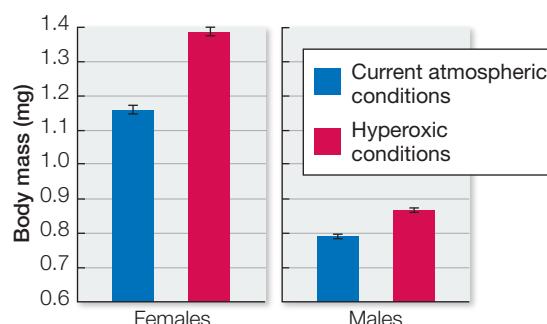
CONCLUSION Increased concentrations led to evolution of larger body size in fruit flies, consistent with the trends seen among other flying insects in the fossil record.
appear to constrain body size in these flying insects, whereas increases in appear to relax those constraints. This experiment demonstrates that the stabilizing selection on body size at present concentrations can quickly switch to directional selection for a change in body size in response to a change in concentrations.
Connect the Concepts Stabilizing selection resists change from a current state, whereas directional selection results in change away from the current state (see Key Concept 19.4).
Extinction happens continuously, but mass extinctions result from sudden environmental changes
The physical and biological components of Earth’s environment are constantly changing. As we saw in Chapter 22, new species are constantly being generated. At the same time, some species decline to the point that they can no longer maintain viable populations and become extinct. Both speciation and extinction have been occurring throughout the history of life. Why do species become extinct? Short-term or long-term environmental fluctuations can make growth or reproduction difficult. As new species arise, they may outcompete existing species for food, space, or other resources. If a prey species becomes extinct, predators that depend on the prey may decline or disappear as well.
As population sizes decrease, the probability of extinction accelerates. At any population size, there is variation in reproductive success, and a particular individual may fail to reproduce successfully. When population sizes are very small, such variation has a bigger influence. Low reproduction by a few individuals in a small population is likely to lead to loss of the population. The smaller the population, the larger the role that chance plays. Variation in reproductive rates is less likely to lead to extinction in large populations, where chance effects play a much smaller role.
Smaller populations can also have density-dependent disadvantages compared with larger populations—a phenomenon known as the Allee effect. Allee effects can occur, for example, from the inability of a small group to defend itself against predators, or from a decline in the ability of individuals to find mates. Small populations can also decline from the negative effects of inbreeding depression and genetic drift (see Chapter 19). These processes can result in loss of genetic variation, uncovering of deleterious alleles, and loss of beneficial alleles.
An experiment on sea palms (a species of kelp) illustrates the relative influence of various factors on extinction probability as it relates to population size (Figure 23.10). Biologists experimentally established isolated populations of sea palms on intertidal rocky shores and examined their survivorship through time. At small population sizes, random demographic factors were most likely to lead to local extinction, whereas environmental fluctuations were much more likely to cause the extinction of larger populations.
The five mass extinction events shown in Figure 23.2 are notable because they suddenly increased the extinction rate and affected a large percentage of living organisms at the same time. In each case, rapid and extreme environmental changes caused many species to become extinct simultaneously.
Work with the Data
Original Papers: J. F. Harrison and G. G. Haddad. 2011. Effects of oxygen on growth and size: Synthesis of molecular, organismal and evolutionary studies with Drosophila melanogaster. Annu Rev Physiol 73: 13.1–13.9.
J. F. Harrison et al. 2010. Atmospheric oxygen level and the evolution of insect body size. Proc R Soc Lond B Biol Sci 277: 1937–1946.
The data in the bar graphs show that the body mass of individuals in the experimental populations of Drosophila increased, on average, about 2% per generation under hyperoxic conditions (although the rate of increase was not constant over the experiment). Here you will extrapolate from Harrison et al.’s study to determine whether the observed rate of increase in body mass per generation that these researchers observed in Drosophila is sufficient to account for the giant dragonflies of the Permian.
QUESTIONS►
Suppose that the average rate of increase in dragonfly size during the Permian was much slower than the rate observed in the experiment. For this exercise, assume that the actual rate of increase for dragonflies was just 0.01% per generation, rather than the 2% observed over a few generations for Drosophila. Also assume that dragonflies complete only 1 generation per year (as opposed to 40 or more generations for Drosophila). Starting with an average body mass of 1 gram, calculate the projected increase in dragonfly body mass over 50,000 years. This calculation is similar to computing compound interest for a savings account. Use the formula where = the final mass, = the starting mass, = the rate of increase per generation (0.0001 in this case), and = the number of generations.
- What percent of the Permian does 50,000 years represent? Use Table 23.1 for your calculation.
- Given your calculations, do you think that increased concentrations during the Permian were sufficient to account for the evolution of giant dragonflies? Why or why not?
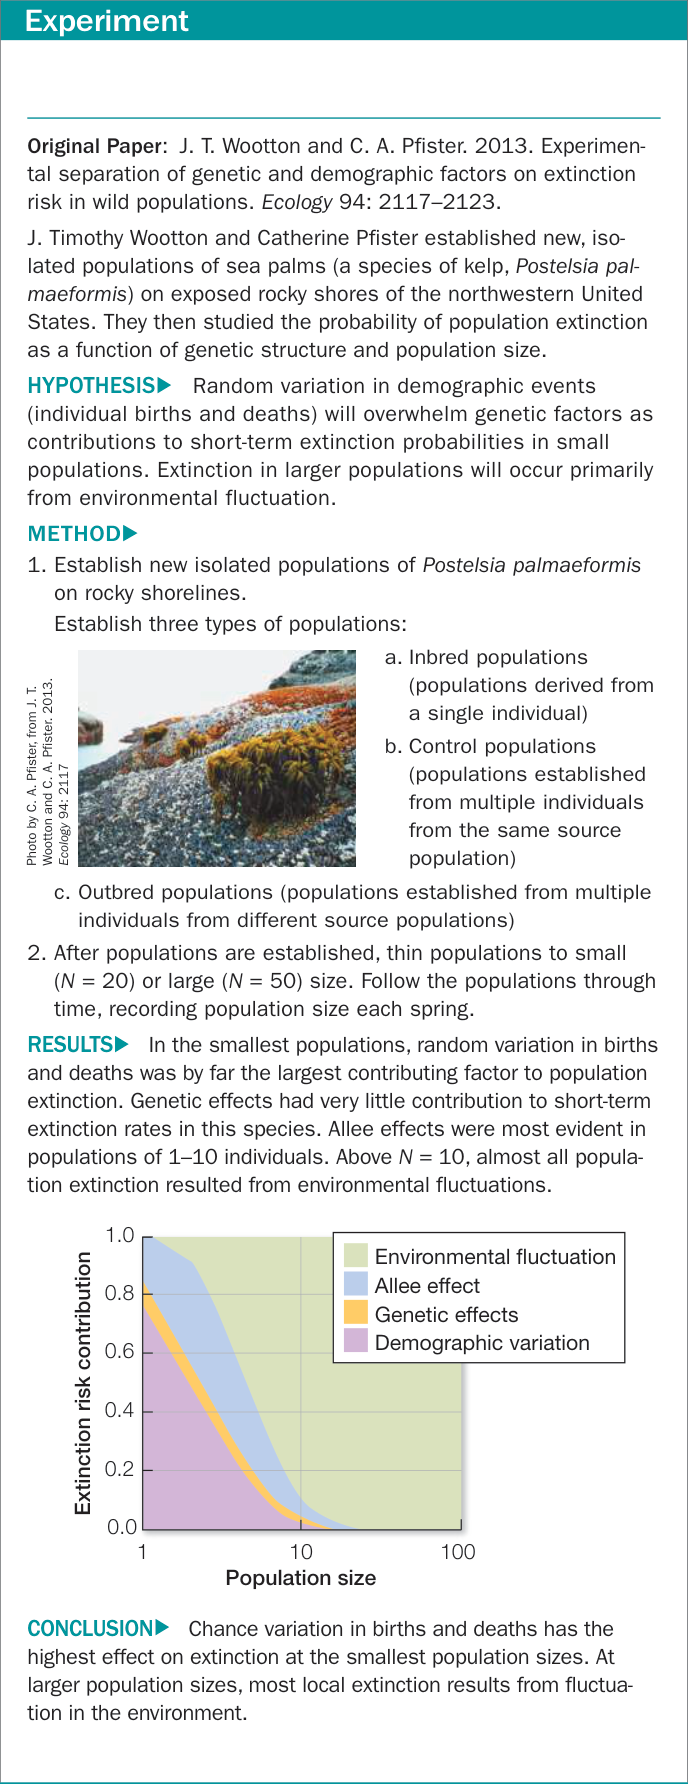
Figure 23.10A What Factors Influence Extinction in Small Populations?
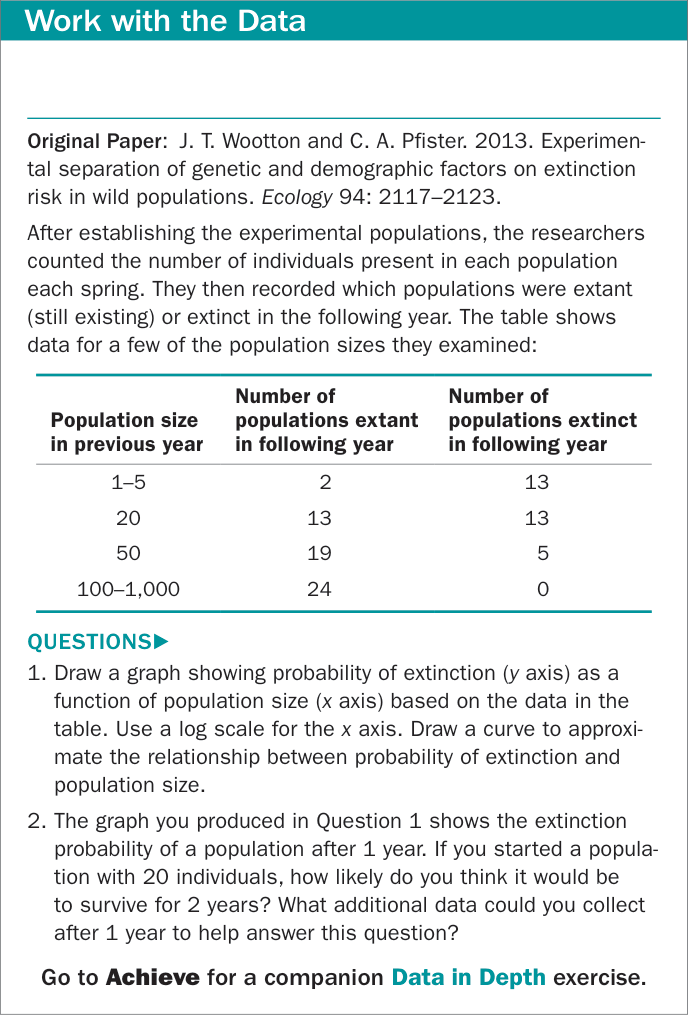
Figure 23.10B What Factors Influence Extinction in Small Populations?
Recap and Assess
Physical conditions on Earth have changed dramatically over time. Changes in Earth’s climate and sea levels have had major effects on biological evolution. Continental drift, volcanic eruptions, and large meteorite strikes have contributed to major climate changes during Earth’s history, and many of these climate shifts have resulted in mass extinction events. Changes in atmospheric concentrations of have also influenced the evolution of life, and the evolution of life has, in turn, affected the physical nature of the planet.
- Explain why an occasional major winter blizzard is irrelevant to discussions of global climate warming.
- Describe changes in the environment that may have favored the evolution of groups of multicellular organisms near the end of the Precambrian.
The many dramatic physical events in Earth’s history have influenced the nature and timing of evolutionary changes among Earth’s living organisms. Next we look more closely at some of the major events that characterize the history of life on Earth.
Major Events in the Evolution of Life Can Be Read in the Fossil Record
Learning Objectives
- 23.3.1 List four major environmental changes in Earth’s history and explain how they have affected biodiversity.
- 23.3.2 Explain what is meant by the “Cambrian explosion” and identify the factors that enabled rapid diversification of multicellular organisms.
How do we know about the physical changes in Earth’s environment and their effects on the evolution of life? To reconstruct life’s history, scientists rely heavily on the fossil record. As we have seen, geologists divided Earth’s history into eons, eras, and periods based on their distinct fossil assemblages (see Table 23.1). Biologists refer to the assemblage of all organisms of all kinds living at a particular time or place as a biota. All of the plants living at a particular time or place are its flora; all of the animals are its fauna.
About 300,000 species of fossil organisms have been described and named, and the number steadily grows. The number of named species, however, is only a tiny fraction of the species that have ever lived. We do not know how many species lived in the past, but we have ways of making reasonable estimates. Of the present-day biota, about 1.8 million species have been named. The actual number of living species is probably well over 10 million, and possibly much higher, because many species have not yet been discovered and described by biologists. So the number of described fossil species is only about 3% of the estimated minimum number of living species. Life has existed on Earth for about 3.8 billion years. Many species last only a few million years before undergoing speciation or becoming extinct. From this we know that Earth’s biota must have turned over many times during geological history. So the total number of species that have lived over evolutionary time must vastly exceed the number living today. Why have only about 300,000 of these tens of millions of species been described from fossils to date?
Several factors contribute to the paucity of fossils
Only a tiny fraction of organisms ever become fossils, and only a tiny fraction of fossils are ever discovered by paleontologists. Most organisms live and die in oxygen-rich environments, in which they quickly decompose. Organisms are not likely to become fossils unless they are transported by wind or water to sites that lack oxygen, where decomposition proceeds slowly. Furthermore, geological processes transform many rocks, destroying the fossils they contain, and many fossil-bearing rocks are deeply buried and inaccessible. Paleontologists have studied only a tiny fraction of the sites that contain fossils, although they find and describe many new ones every year.
The fossil record is most complete for marine animals that had hard skeletons (which resist decomposition). Among the nine major animal groups with hard-shelled members, approximately
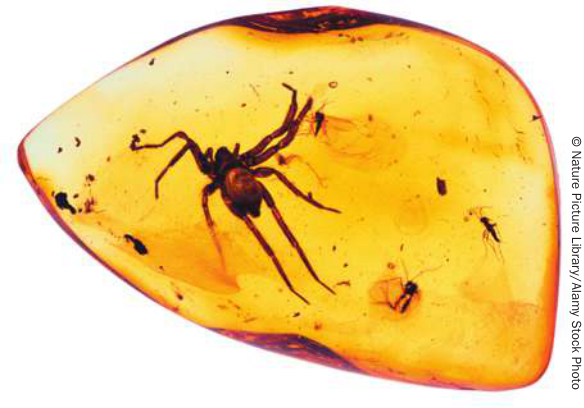
Figure 23.11 Fossils in Amber Chunks of amber—fossilized tree resin—often contain detailed fossils such as this spider, which was preserved when it became trapped in the sticky resin.
200,000 species have been described from fossils—roughly twice the number of living marine species in these same groups. Paleontologists lean heavily on these groups in their interpretations of the evolution of life. Insects and arachnids are also relatively well represented in the fossil record because they are numerically abundant and have hard exoskeletons (Figure 23.11). The fossil record, though incomplete, is good enough to document clearly the factual history of the evolution of life.
By combining information about physical changes during Earth’s history with evidence from the fossil record, scientists have composed portraits of what Earth and its inhabitants may have looked like at different times. We know in general where the continents were and how life changed over time, but many of the details are poorly known, especially for events in the more remote past.
Precambrian life was small and aquatic
Life first appeared on Earth about 3.8 billion years ago (Figure 23.12). The fossil record of organisms that lived prior to the Phanerozoic is fragmentary, but it is good enough to establish that diversity of multicellular organisms increased dramatically in the late Precambrian.
For most of its history, life was confined to the oceans, and all organisms were small. For more than 3 billion years, all organisms lived in shallow seas. These seas slowly began to teem with microscopic prokaryotes. After the first eukaryotes appeared during the Proterozoic, they began to feed on the much smaller prokaryotes. As eukaryotes diversified, small floating organisms, known collectively as plankton, were strained from the water and eaten by larger filter-feeding eukaryotes. Other eukaryotes ingested sediments on the seafloor and digested the remains of organisms within them. But it still took about a billion years for eukaryotes to begin diversifying rapidly into the many different multicellular groups that we know today.
What limited the diversity of multicellular eukaryotes (in terms of their size and shape) for much of their early existence? It is likely that a combination of factors was responsible. We have already noted that oxygen levels increased throughout the Proterozoic, and it is likely that high atmospheric and dissolved oxygen concentrations were needed to support large multicellular organisms. In addition, geological evidence points to a series of intensely cold periods during the late Proterozoic, which would have resulted in seas that were largely covered by ice and continents that were covered by glaciers. The “snowball Earth” hypothesis suggests that cold conditions confined life to warm places such as hot springs, deep thermal vents, and perhaps a few equatorial oceans that avoided ice cover. The last of these Proterozoic glaciations ended about 580 million years ago, just before several major radiations of multicellular eukaryotes appear in the fossil record (Figure 23.13). Many of the multicellular organisms known from the late Proterozoic and early Phanerozoic were very different from any animals living today and may be members of groups that left no living descendants.
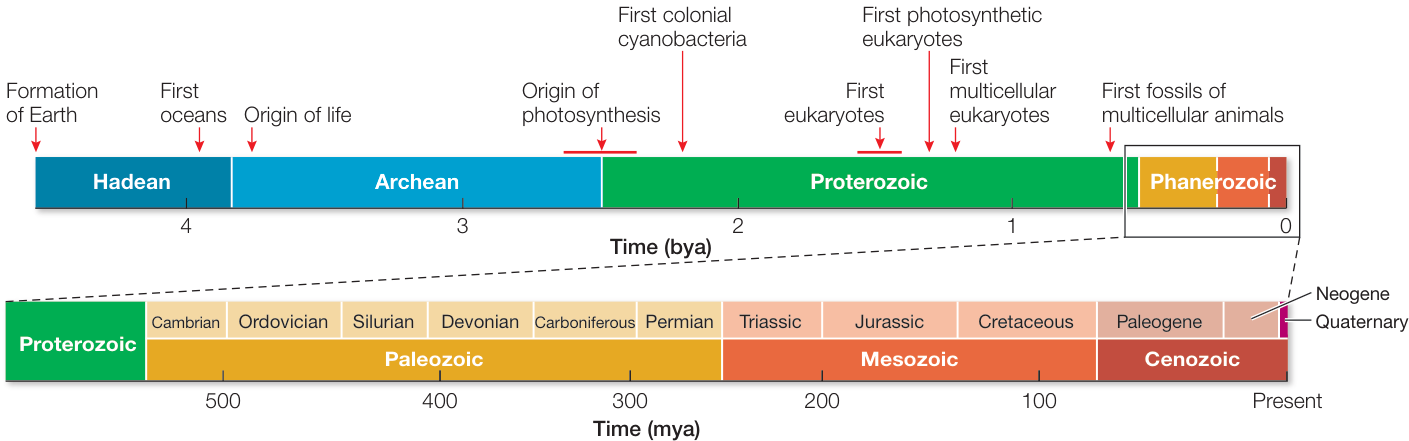
Figure 23.12 A Sense of Life’s Time The top time line shows the 4.5-billion-year history of Earth. Most of this history is accounted for by the Precambrian, a 4-billion-year time span that saw the origin of life and CHAPTER 23 The History of Life on Earth the evolution of cells, photosynthesis, and multicellularity. The most recent 600 million years are expanded in the bottom time line and detailed in Figure 23.14.
Life expanded rapidly during the Cambrian
The Cambrian (542–488 mya) marks the beginning of the Paleozoic, the first era of the Phanerozoic. The concentration in the Cambrian atmosphere was approaching its current level, and the glaciations of the late Proterozoic had ended nearly 40 million years earlier. A geologically rapid diversification of life took place that is often called the Cambrian explosion. This name is somewhat misleading, as the series of radiations it refers to actually began before the start of the Cambrian and continued for about 60 million years into the early Cambrian (see Figure 23.13). Nonetheless, 60 million years represents a relatively short amount of time, especially considering that the first eukaryotes had appeared about a billion (= 1,000 million) years earlier. Many of the major animal groups represented by species alive today first appeared during these evolutionary radiations. Figure 23.14 provides an overview of the numerous continental and biotic innovations that have characterized the Phanerozoic.
For the most part, fossils tell us only about the hard parts of organisms, but in some well-studied Cambrian fossil beds the soft parts of many animals were preserved. Multicellular life was largely or completely aquatic during the Cambrian. If there was life on land at this time, it was probably restricted to microorganisms.
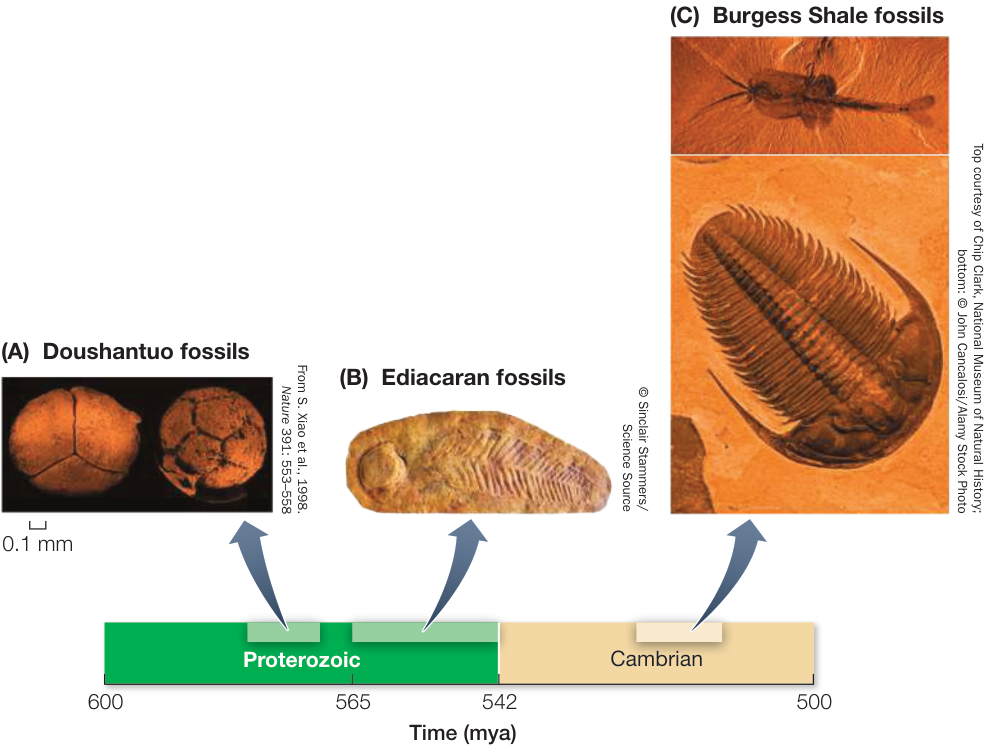
Figure 23.13 Diversification of Multicellular Organisms: The Cambrian Explosion Shortly after the end of Proterozoic glaciations (about 580 mya), several major radiations of multicellular organisms appear in the fossil record. (A) These microscopic fossils from the Doushantuo rock formation of China are the remains of tiny four- and eight-celled stages of multicellular organisms. (B) Unusual soft-bodied marine invertebrates, unlike any animals alive at present, characterize the fossilized fauna preserved at Ediacara in southern Australia. (C) By the early Phanerozoic, fossilized faunas such as those preserved in Canada’s Burgess Shale include extinct representatives of some of the major animal groups alive today.
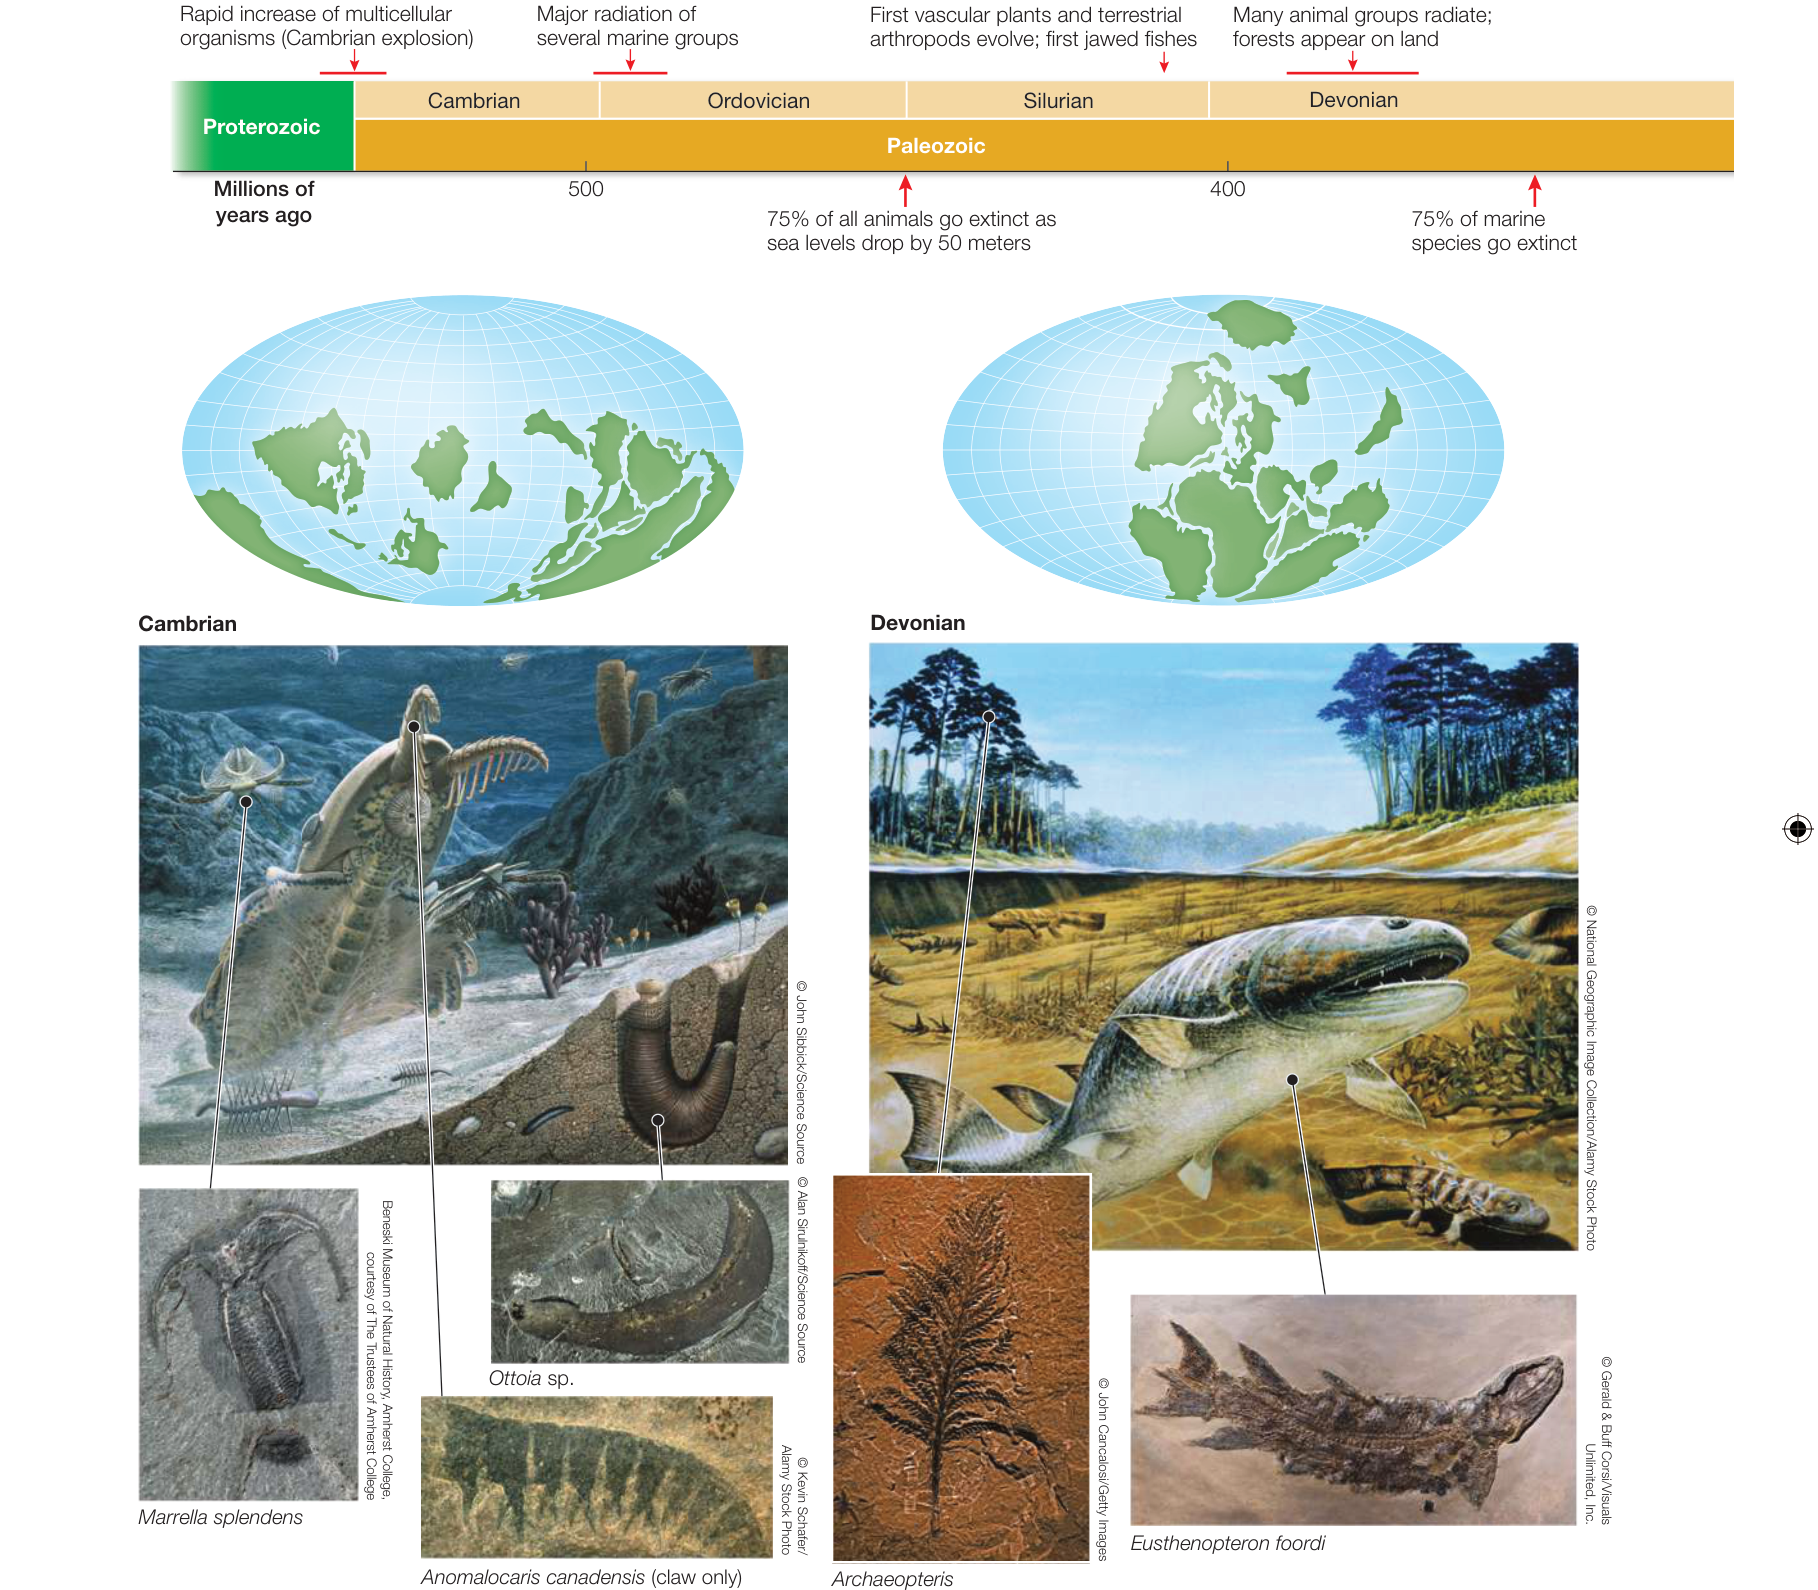
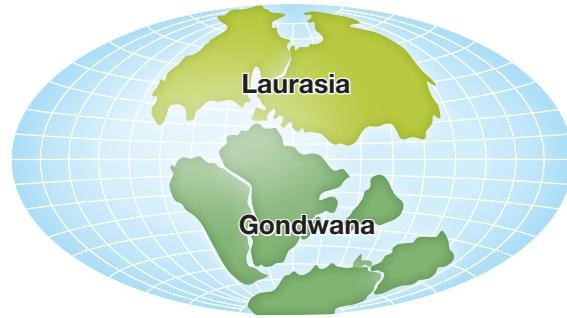
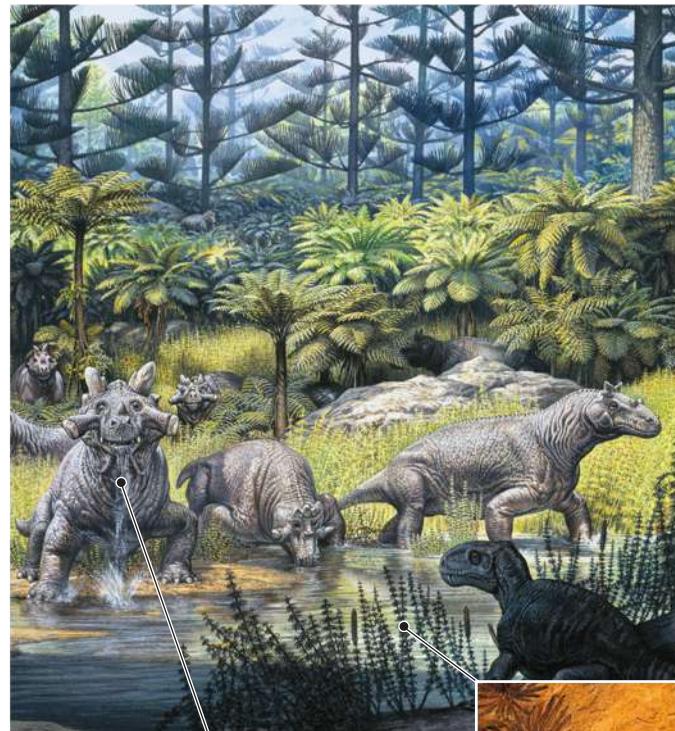
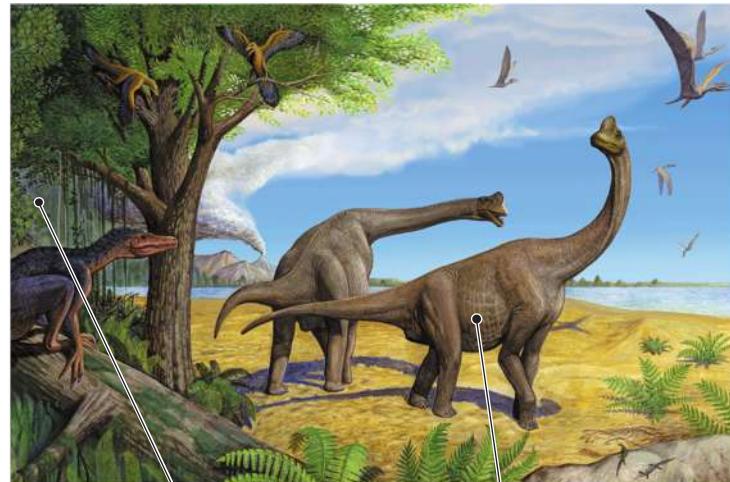
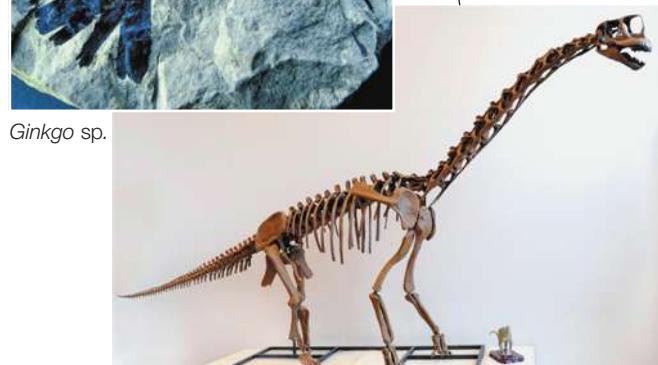
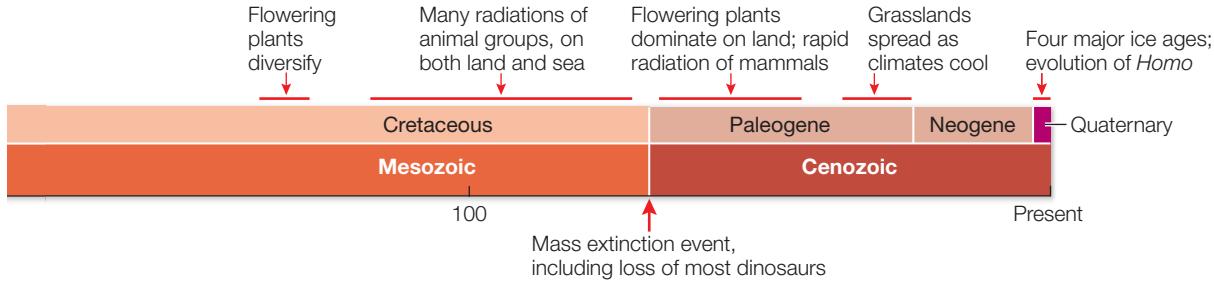
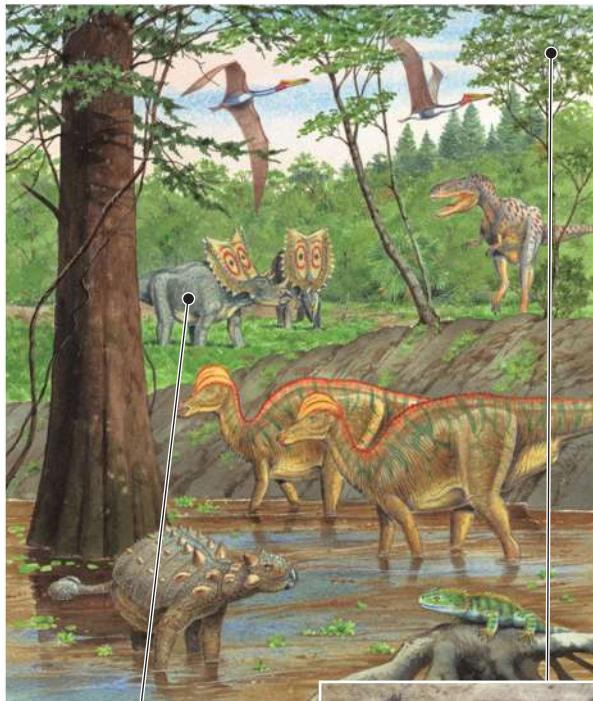
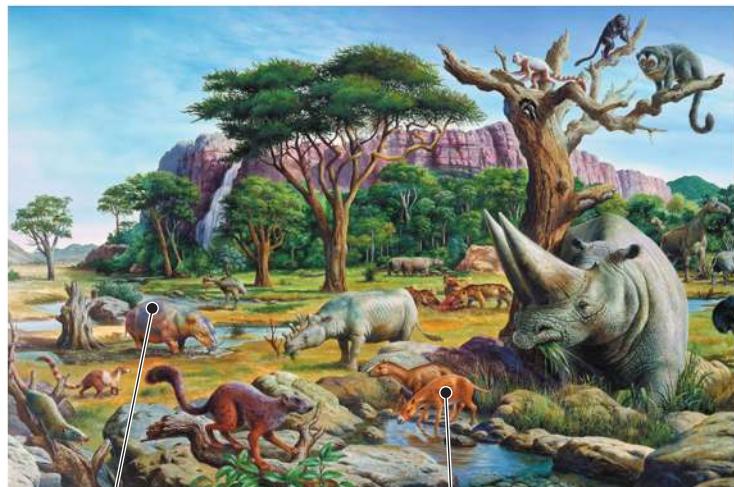
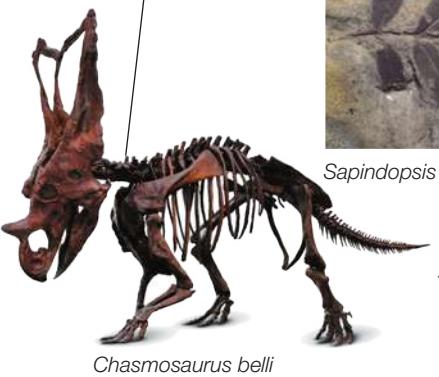
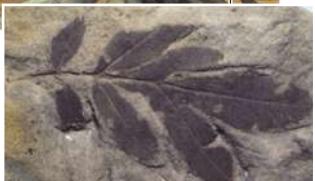
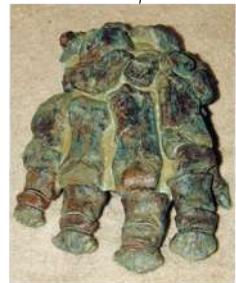
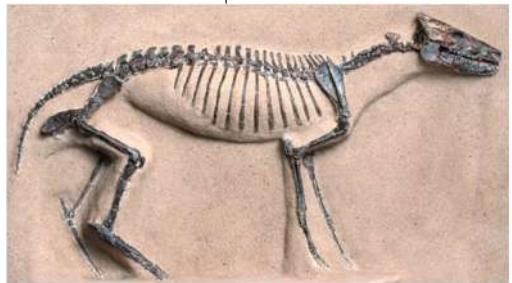
Figure 23.14 A Brief History of Multicellular Life on Earth The geologically rapid “explosion” of life shortly before and during the Cambrian saw the rise of many major animal groups that have representatives surviving today. The following three pages depict life’s history through the Phanerozoic. The movements of the major continents during the past half-billion years are shown in the maps of Earth, and associated biotas for each time period are depicted. The artists’ reconstructions are based on fossils such as those shown in the photographs. (After R. S. Dietz and J. C. Holden. 1970. J Geophys Res 75: 4939–4956; R. S. Dietz and J. C. Holden. 1970. Sci Am 223: 30–41.)

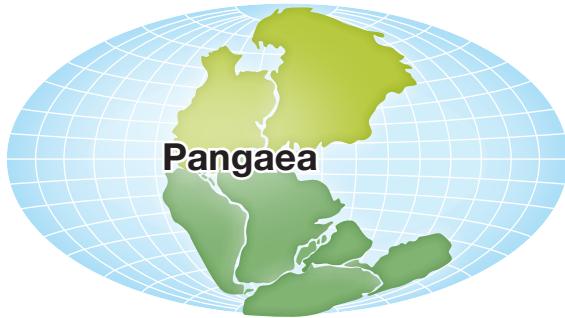
Permian
Jurassic
© Sergey Krasovsky/Stocktrek Images/Corbis
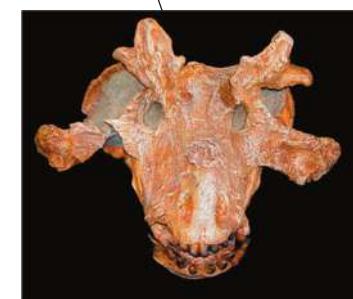
Estemmenosuchus sp.
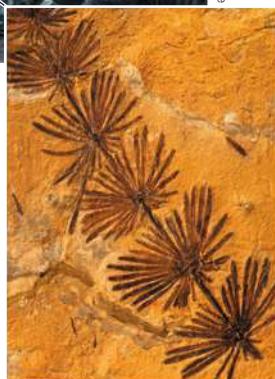
Equisetum sp.
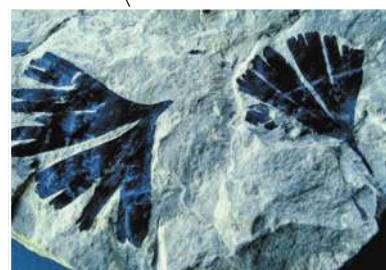
Ginkgo sp.
dpa picture alliance archive/Alemy Stock Photo


Cretaceous
Paleogene
Chasmosaurus belli
Sapindopsis belviderensis (leaves)
Coryphodon
Hyracotherium sp.
© Publichoto/Science Source Bereski Museum of Natural History. Amherst College, courtesy of The Trustees of Amherst College
Many groups of organisms that arose during the Cambrian later diversified
Geologists divide the remainder of the Paleozoic into the Ordovician, Silurian, Devonian, Carboniferous, and Permian periods. Each period is characterized by the diversification of specific groups of organisms. Mass extinctions marked the ends of the Ordovician, Devonian, and Permian.
THE ORDOVICIAN (488–444 MYA) During the Ordovician, the continents, which were located primarily in the Southern Hemisphere, still lacked multicellular life. Evolutionary radiation of marine organisms, however, was spectacular during the early Ordovician, especially among animals, such as brachiopods and mollusks, that lived on the seafloor and filtered small prey from the water. At the end of the Ordovician, as massive glaciers formed over the southern continents, sea levels dropped about 50 meters, and ocean temperatures dropped. About 75% of all animal species became extinct, probably because of these major environmental changes.
THE SILURIAN (444–416 MYA) During the Silurian, the continents began to merge together. Marine life rebounded from the mass extinction at the end of the Ordovician. Animals able to swim in open water and feed above the ocean floor appeared for the first time. Fishes diversified as bony armor gave way to the less rigid scales of modern fishes, and the first jawed fishes and the first fishes with supporting rays in their fins appeared. The tropical sea was uninterrupted by land barriers, and most marine organisms were widely distributed. On land, the first vascular plants evolved late in the Silurian (about 420 mya). The first terrestrial arthropods—scorpions and millipedes—evolved at about the same time.
THE DEVONIAN (416–359 MYA) Rates of evolutionary change accelerated in many groups of organisms during the Devonian. The major land masses continued to move slowly toward each other. In the oceans there were great evolutionary radiations of corals and of shelled, squid-like cephalopod mollusks.
Terrestrial communities changed dramatically during the Devonian. Club mosses, horsetails, and tree ferns became common, and some attained the size of large trees. Their roots accelerated the weathering of rocks, resulting in the development of the first forest soils. The first plants to produce seeds appeared in the Devonian. The earliest fossil centipedes, spiders, mites, and insects date to this period, as do the earliest terrestrial vertebrates.
A mass extinction of about 75% of all marine species marked the end of the Devonian. Paleontologists are uncertain about its cause, but two large meteorites collided with Earth at about that time and may have been responsible, or at least a contributing factor. The continued merging of the continents, with the corresponding reduction in the area of continental shelves, also may have contributed to this mass extinction.
THE CARBONIFEROUS (359–299 MYA) Large glaciers formed over high-latitude portions of the southern land masses during the Carboniferous, but extensive swamp forests grew on the tropical continents. These forests were dominated by giant tree ferns and horsetails with small leaves. Their fossilized remains formed the coal we now mine for energy. In the seas, crinoids (a group of echinoderms, related to sea stars and sea urchins) reached their greatest diversity, forming “meadows” on the seafloor.
The diversity of terrestrial animals increased greatly during the Carboniferous. Snails, scorpions, centipedes, and insects were abundant and diverse. Insects evolved wings, becoming the first animals to fly. Flight gave herbivorous insects easy access to tall plants, and plant fossils from this period show evidence of chewing by insects (Figure 23.15). The terrestrial vertebrates split into two lineages. The amphibians became larger and better adapted to terrestrial existence, while the sister lineage led to the amniotes—vertebrates with well-protected eggs that can be laid in dry places.
THE PERMIAN (299–251 MYA) During the Permian, the continents merged into a single supercontinent called Pangaea. Permian rocks contain representatives of many of the major groups of insects we know today. By the end of the period the amniotes had split into two lineages: the reptiles, and a second lineage that would lead to the mammals. Ray-finned fishes became common in the fresh waters of Pangaea.
Toward the end of the Permian, conditions for life deteriorated. Massive volcanic eruptions resulted in outpourings of lava that covered large areas of Earth. The ash and gases produced by the volcanoes blocked sunlight and cooled the climate. The death and decay of the massive Permian forests rapidly used up atmospheric oxygen, and the loss of photosynthetic organisms meant that relatively little new atmospheric oxygen was produced. In addition, much of Pangaea was located close to the South Pole by the end of the Permian. All of these factors combined to produce the most extensive continental glaciers since the snowball Earth times of the late Proterozoic. Atmospheric oxygen concentrations gradually dropped from about 30% to 15%. At such low concentrations, most animals would have been unable to survive at elevations above 500 meters, so about half of the land area would have been uninhabitable at the end of the Permian. The combination of these changes resulted in the most drastic mass extinction in Earth’s history. Scientists estimate that about 96% of all multicellular species became extinct at the end of the Permian.
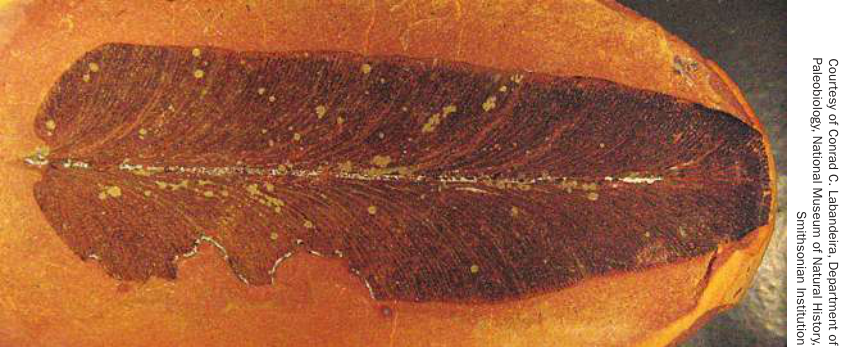
Figure 23.15 Evidence of Insect Diversification The margins of this fossil fern leaf from the Carboniferous have been chewed by insects.
Geographic differentiation increased during the Mesozoic
The few organisms that survived the Permian mass extinction found themselves in a relatively empty world at the start of the Mesozoic Era (251 mya). As Pangaea slowly began to break apart in the Mesozoic, the biotas of the newly separated continents began to diverge. The oceans rose and once again flooded the continental shelves, forming huge, shallow inland seas. Atmospheric oxygen concentrations gradually rose as photosynthesis increased. Life once again proliferated and diversified, but different groups of organisms came to the fore. The three groups of phytoplankton (floating photosynthetic organisms) that dominate today’s oceans—dinoflagellates, coccolithophores, and diatoms—became ecologically important at this time, and their remains are the primary origin of the world’s oil deposits. Seed-bearing plants replaced the trees that had ruled the Permian forests.
The Mesozoic is divided into three periods: the Triassic, Jurassic, and Cretaceous. The Triassic and Cretaceous were terminated by mass extinctions, probably caused by meteorite impacts.
THE TRIASSIC (251–201.6 MYA) Pangaea remained largely intact through the Triassic. Many invertebrate groups diversified, and many burrowing animals evolved from groups living on the surfaces of seafloor sediments. On land, conifers and seed ferns were the dominant trees. The first frogs and turtles appeared. A great radiation of reptiles began, which eventually gave rise to crocodilians and dinosaurs (including birds). The first mammals appeared. The end of the Triassic was marked by a mass extinction that eliminated about 65% of the species on Earth.
THE JURASSIC (201.6–145.5 MYA) Late in the Jurassic, Pangaea became fully divided into two large continents: Laurasia, which drifted northward, and Gondwana in the south. Ray-finned fishes rapidly diversified in the oceans. The first lizards appeared, and flying reptiles (pterosaurs) evolved. Most of the large terrestrial predators and herbivores of the period were dinosaurs. Several groups of mammals made their first appearance, and the earliest known fossils of flowering plants are from late in this period.
THE CRETACEOUS (145.5–65.5 MYA) By the mid-Cretaceous, Gondwana had largely broken apart into the southern continents we know today (although the Indian subcontinent was still separated from Asia). A continuous sea encircled the tropics. Sea levels were high, and Earth was warm and humid. Life proliferated both on land and in the oceans. Marine invertebrates increased in diversity. On land, the reptile radiation continued as dinosaurs diversified further and the first snakes appeared. Early in the Cretaceous, flowering plants began the radiation that led to their current dominance of the land. By the end of the period, many groups of mammals had appeared.
As described in Key Concept 23.2, another meteorite-caused mass extinction took place at the end of the Cretaceous. In the seas, many planktonic organisms and bottom-dwelling invertebrates became extinct. On land, almost all animals larger than about 25 kilograms in body mass became extinct. Many species of insects died out, perhaps because the growth of the plants they fed on was greatly reduced following the impact. Some species in northern North America and Eurasia survived in areas that were not subjected to the devastating fires that engulfed most low-latitude regions.
Modern biotas evolved during the Cenozoic
By the early Cenozoic Era (65.5 mya), the positions of the continents were getting closer to their present positions, but the Indian subcontinent was still separated from Asia, and the Atlantic Ocean was much narrower. The early Cenozoic was characterized by extensive radiations of amphibians, reptiles, and mammals, but other groups were also undergoing important changes.
Flowering plants diversified extensively and came to dominate world forests except in the coolest regions, where the forests were composed primarily of gymnosperms. Novel changes in one group of plants (the legumes) allowed them to use atmospheric nitrogen directly by forming symbioses with a few species of nitrogen-fixing bacteria. The evolution of this symbiosis was the first “green” revolution and dramatically increased the amount of nitrogen available for terrestrial plant growth. This symbiosis remains fundamental to the ecological base of life as we know it today.
The Cenozoic is divided into the Paleogene, Neogene, and Quaternary periods, which are commonly subdivided into epochs (Table 23.2). The Paleogene and Neogene are often referred to as the Tertiary when they are discussed together, especially in the older literature.
THE PALEOGENE (65.5–23.0 MYA) During the Paleogene, the Indian subcontinent continued its northward drift. By about 55 mya it made initial contact with parts of southeastern Asia. By about 35 mya, the Indian Plate ran fully into the Eurasian Plate, and the Himalayas began to be pushed up as a result.
The early Paleogene was a hot and humid time, as levels in Earth’s atmosphere were high, which produced a greenhouse effect. The tropics were probably too hot to support rainforest vegetation and instead were clothed in low-lying vegetation. By late in the Paleogene, however, increased plankton growth in the oceans, combined with the eventual burial of plankton in oceanic sediments, led to the removal of considerable from Earth’s atmosphere, and the climate became considerably cooler and drier. Many lineages of flowering plants evolved herbaceous (nonwoody) forms, and grasslands spread over much of Earth.
Amphibians, snakes, lizards, birds, and mammals all underwent extensive radiations during the Paleogene. The first of several waves
Table 23.2 Subdivisions of the Cenozoic Era
| Period | Epoch | Onset (mya) |
|---|---|---|
| Quaternary | Holocene (Recent) | 0.01 (~10,000 years ago) |
| Pleistocene | 2.6 | |
| Neogene | Pliocene | 5.3 |
| Miocene | 23 | |
| Paleogene | Oligocene | 34 |
| Eocene | 55.8 | |
| Paleocene | 65.5 |
of plants and terrestrial animals dispersed between Asia and North America across one of the several land bridges that have intermittently connected the two continents during the past 55 million years.
THE NEOGENE (23.0–2.6 MYA) During the Neogene, the continents began to take their current positions. North and South America became connected by the Isthmus of Panama, which resulted in considerable interchange of plants and terrestrial animals between the two continents. For the same reason, the tropical areas of the Atlantic and Pacific oceans became isolated from one another, which resulted in divergence of the respective marine faunas of these oceans. Diversification of major plant and animal groups continued, as the biotas of the continents began to resemble those we see today.
THE QUATERNARY (2.6 MYA TO PRESENT) We are living in the Quaternary. It is subdivided into two epochs, the Pleistocene and the Holocene (the Holocene is also known as the Recent).
The Pleistocene was a time of drastic cooling and climate fluctuations. During 4 major and about 20 minor ice ages, massive glaciers spread across the continents, and the ranges of animal and plant populations shifted toward the equator. The last of these glaciers retreated from temperate latitudes less than 15,000 years ago. Organisms are still adjusting to this change. Many high-latitude ecological communities have occupied their current locations for no more than a few thousand years.
It was during the Pleistocene that divergence within one group of mammals, the primates, resulted in the evolution of the hominoid lineage. Subsequent hominoid radiation eventually led to the species Homo sapiens—modern humans. Many large bird and mammal species became extinct in Australia and in the Americas after H. sapiens arrived on those continents about 45,000 and 15,000 years ago, respectively. Many paleontologists believe at least some of these extinctions were the result of hunting and other influences of humans.
Connect the Concepts The evolution of modern humans and their close relatives during the Pleistocene is discussed in Key Concept 31.5.
The tree of life is used to reconstruct evolutionary events
The fossil record reveals broad patterns in life’s evolution. To reconstruct major events in the history of life, biologists also rely on the phylogenetic information in the tree of life (see Appendix A). We can use phylogeny, in combination with the fossil record, to reconstruct the timing of such major events as the acquisition of mitochondria in the ancestral eukaryotic cell, the several independent origins of multicellular organisms, and the movement of life onto dry land. We can also follow major changes in the genomes of organisms, and we can even reconstruct many gene sequences of species that are long extinct.
Connect the Concepts Key Concept 20.3 describes how biologists reconstruct the gene sequences of extinct organisms.
Changes in Earth’s physical environment have clearly influenced the diversity of organisms we see on the planet today. To study the evolution of that diversity, biologists examine the evolutionary relationships among species. Deciphering phylogenetic relationships is an important step in understanding how life has diversified on Earth. The next part of this book will explore the major groups of life and the different solutions these groups have evolved to meet major challenges such as reproduction, energy acquisition, dispersal, and escape from predation.
Recap and Assess
Life evolved in the oceans about 3.8 billion years ago. The evolution of photosynthesis resulted in increased concentrations of atmospheric oxygen, which facilitated both the evolution of multicellular organisms and the invasion of life onto land. Numerous climate changes and rearrangements of the continents, as well as meteorite impacts, contributed to five major mass extinctions.
- Give a likely reason for the “green” revolution of the Cenozoic, and explain why it enabled flowering plants to diversify.
- Compare the tree of life in Appendix A (see Figures A1 and A2) with the chronology of major events in Table 23.1. To represent the diversity of life in one figure, the tree in the appendix is not drawn proportionally in relation to time. Which geological eon, era, or period seems most compressed on the tree, and why?

Activity 23.1 Concept Matching:
The History of Life on Earth
Investigating Life
QA How can modern experiments test hypotheses about the evolutionary impact of ancient environmental changes?
Several experiments have been conducted to test the link between concentrations and evolution of body size in flying insects (one of these is discussed in Investigating Life: The Relationship between Atmospheric Oxygen Concentration and Body Size in Insects). Results of these experiments are consistent with the evolution of larger body size in flying insects in hyperoxic (high-oxygen) environments. Experiments have also been conducted under hypoxic (low-oxygen) conditions, such as existed at the end of the Permian. Results of these experiments suggest that the evolution of body size is constrained under hypoxic conditions, even under strong artificial selection for larger body size. These latter results are consistent with the extinction of many of the large flying insects at the end of the Permian, the result of rapidly decreasing concentrations. Giant flying insects simply could not have survived the lower concentrations that existed at that time. The mass extinction at the end of the Permian is the only known mass extinction that involved considerable loss of insect diversity.
Future directions
Experiments with living organisms are providing information about how quickly various groups of organisms evolve. They also inform us about the factors involved in extinction of species (as in the example in Figure 23.10). As human activities affect the climate of Earth, experimental approaches will be important to help us predict how our actions may affect future directions of evolution and extinction.
© Michael Matti/Alamy Stock Photo
You should be able to relate each summary to the adjacent figures. If you go to this visual summary in Achieve, you can follow links to figures, animations, activities, and simulations that will help you consolidate the material.
Visual Summary
Events in Earth’s History Can Be Dated
- The relative ages of organisms can be determined by the dating of fossils and the strata of sedimentary rocks in which they are found.
- Radiometric dating techniques use a variety of radioisotopes with different half-lives to date events in the remote past.
- Geologists divide the history of life into eons, eras, and periods based on major differences in the fossil assemblages found in successive strata.
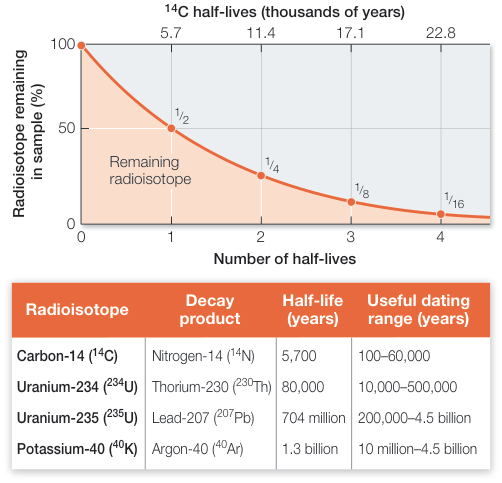
Figure 23.1
Table 23.1 Earth’s Geological History
| Eon | Era | Period | Onset |
|---|---|---|---|
| Phanerozoic (~0.5 billion years long) | Cenozoic | Quaternary (Q) | 2.6 mya |
| Neogene (N) | 23.0 mya | ||
| Paleogene (Pg) | 65.5 mya | ||
| Cretaceous (K) | 145.5 mya | ||
| Mesozoic | Jurassic (J) | 201.6 mya | |
| Triassic (Tr) | 251.0 mya | ||
| Permian (P) | 299 mya | ||
| Carboniferous (C) | 359 mya | ||
| Paleozoic | Devonian (D) | 416 mya | |
| Silurian (S) | 444 mya | ||
| Ordovician (O) | 488 mya | ||
| Cambrian (C) | 542 mya | ||
| Proterozoic | Collectively called the Precambrian (~4 billion years long) | 2.5 bya | |
| Archean | 3.8 bya | ||
| Hadean | 4.6–4.5 bya |
Questions
- How much of the evolutionary history of life was exclusively aquatic? When did plants and animals first colonize the continental land masses?
- Why is carbon-14 dating limited to approximately the past 60,000 years?
- What radioisotopes can be used to date much older rocks, up to the age of Earth?
- How much of Earth’s history does the Phanerozoic represent?
Changes in Earth’s Physical Environment Have Affected the Evolution of Life
- Earth’s crust consists of solid plates that move across the underlying mantle. Continental drift is caused by convection currents in the mantle, which move the plates and the continents that lie on top of them.
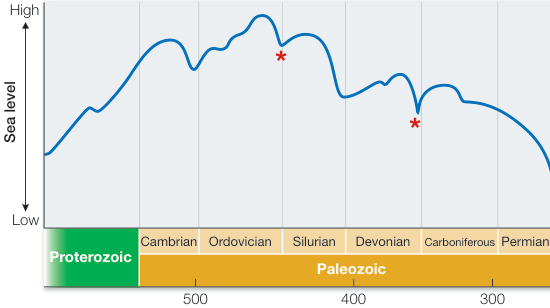
Figure 23.4
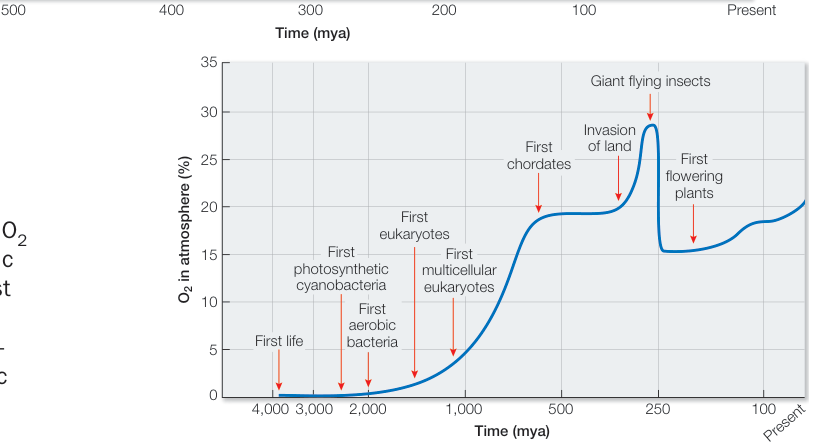
Figure 23.8 - Major physical events on Earth, such as continental collisions and volcanic eruptions, have affected Earth’s climate, atmosphere, and sea levels. In addition, extraterrestrial events such as meteorite strikes have created sudden and dramatic environmental shifts and led to mass extinction events. - Oxygen-generating cyanobacteria liberated enough O2 to open the door to oxidation reactions in metabolic pathways. Aerobic prokaryotes were able to harvest more energy than anaerobic organisms and began to proliferate. Increases in atmospheric O2 concentrations supported the evolution of large eukaryotic cells and, eventually, multicellular organisms.
Questions
Explain how changes in atmospheric oxygen enabled the evolution of multicellular life.
What environmental changes resulted in the sudden drop in atmospheric oxygen at the end of the Permian?
- Describe the relationship between global temperature change and sea level fluctuations.
- How can volcanic eruptions change the global climate?
Major Events in the Evolution of Life Can Be Read in the Fossil Record
■ Paleontologists use fossils and evidence of geological changes to determine what Earth and its biota may have looked like at different times.
■ Before the Phanerozoic, life was almost completely confined to the oceans. Multicellular life diversified extensively during the Cambrian explosion, a prime example of an evolutionary radiation.
■ The periods of the Paleozoic were each characterized by the diversification of specific groups of organisms. During the Mesozoic, distinct terrestrial biotas evolved on each continent.
■ The Cenozoic is divided into the Paleogene, Neogene, and Quaternary periods, which in turn are subdivided into epochs. The Cenozoic saw the emergence of the modern biotas as vertebrates radiated extensively and flowering plants became dominant.
■ The tree of life can be used to reconstruct the timing of evolutionary events.
Questions
- Why are the evolutionary changes in faunas near the beginning of the Cambrian sometimes described as an “explosion”?
- What were two major causes of mass extinction events in Earth’s history?
- When did snowball Earth exist, and why might it be important in understanding the Cambrian explosion?
- Describe the relationship of the modern continents to Gondwana, Laurasia, and Pangaea.
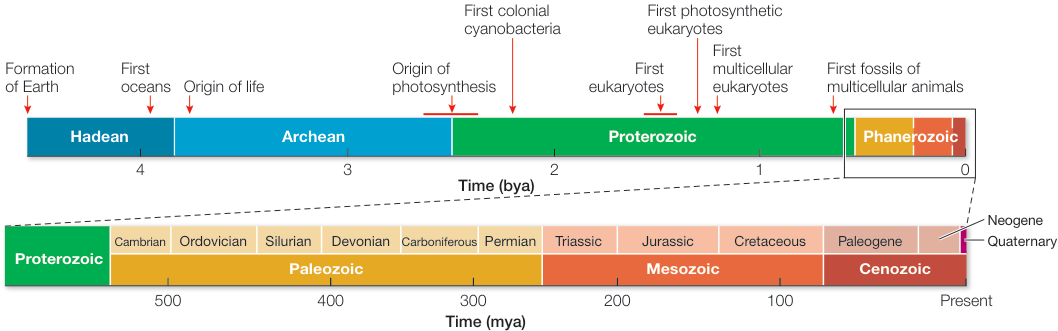
Figure 23.12
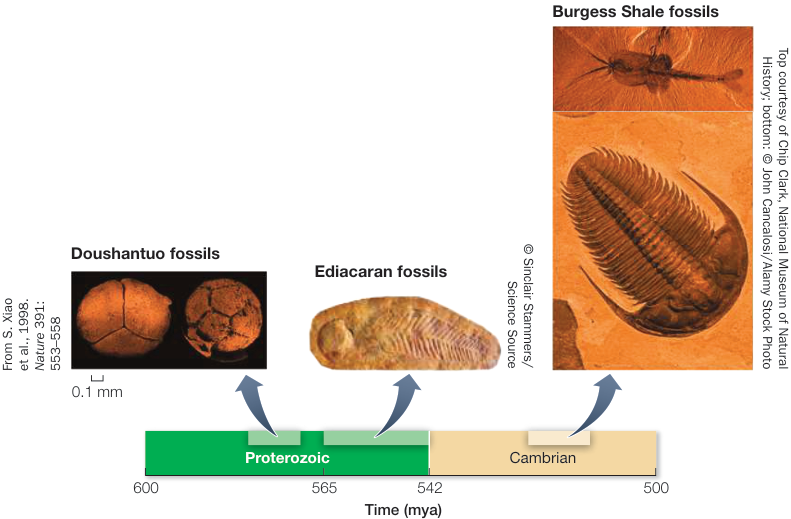
Figure 23.13