Looking at structures
A picture of a protein is the last step of a pipeline that starts with measurements, and the viewer makes choices of its own along the way: which atoms to draw and how, where bonds go, what counts as a helix, where the hydrogens sit, and what color anything is. Most of what you see on screen was decided by software, not measured.
Each representation answers different questions
Most structural models are based upon molecular mechanics assumptions. That is, the atom is modeled as a hard sphere with the radius of the sphere equal to, or some multiple of, the atom's van der Waals radius. Covalent bonds are represented (as they are in the usual 2D chemical graphs) as line segments, or 3D cylinders, joining each of the atoms.
Wireframe, stick, space-filling, and ball and stick
The wireframe model is the simplest molecular model, where line segments represent bonds and the atoms are at the vertices of the line segments. It is often used as the default model when a molecule is first loaded into a molecular visualization application. Its disadvantage is that it is difficult to discern color and 3D structure, especially when viewing larger molecules such as proteins. The stick model can be seen as essentially a thicker wireframe where the bond is represented as a cylinder (also called a "licorice" model).
The CPK model, also known as the space-fill model, was derived from wood and plastic physical models developed by Corey and Pauling and later Koltun. Each atom is represented as an opaque sphere with a radius equal to its van der Waals radius. The CPK model implies volume and is also one of the first surface representations of a molecule. It is useful for showing the size and shape of a molecule, for showing when atoms may collide in certain conformations due to steric hindrance, and for showing cavities. However, it can also obscure details and cause visual clutter when used to model larger molecules.
The ball and stick model is a hybrid between a stick model and a CPK model. Bonds are represented as cylinders and atoms as spheres, whose radii are usually much less than the true van der Waals radii to reduce visual clutter. The ball and stick model is useful for information on topology and for measuring bond angles, torsional angles, and bond lengths, but it still creates visual clutter when used to model proteins.
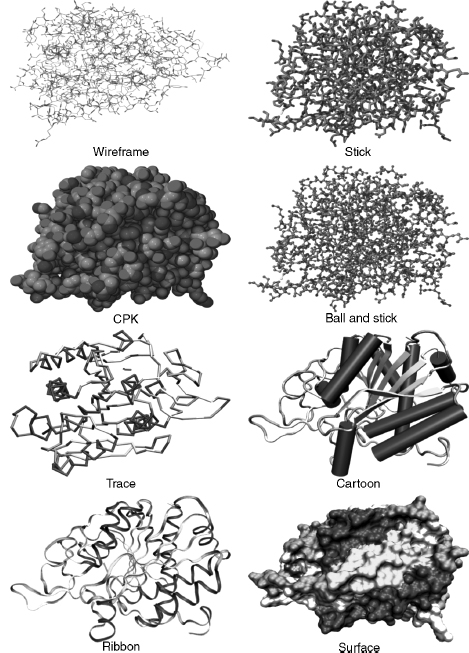
Wireframe, stick, CPK, and ball and stick models may be considered "all-atom" models in that each atom in the protein is explicitly included. The following models use a particular subset of atoms. They were designed to simplify and clarify protein structures and show elements of structure obscured by all-atom representations.
Backbone, trace, and cartoons
The backbone model uses line segments to join each consecutive alpha carbon in the polypeptide. It simplifies the structure, avoids visual clutter, and can reveal elements of secondary structure such as helices, strands, and turns and the conformation and folding of the polypeptide chain. The trace model is similar, except that spline curves are used to generate the trace through the alpha carbons. The mathematics of the curve may mean that the curve does not exactly intersect the coordinates of each alpha carbon, but this makes the model look smoother. Backbone and trace models are also useful for structure comparison, where usually only the coordinates of alpha carbons are considered.
Cartoon models of proteins were derived from hand-drawn models of protein secondary structures by Jane Richardson. Cartoons simplify protein structure to reveal the direction of the protein chain, protein folding, and elements of secondary, supersecondary, and domain structure. Helices are drawn as cylinders or spiral ribbons and β-strands as broad arrows.
The last family is the surfaces of lesson 2.4, the shape a binding partner meets, often colored by a computed property such as electrostatic potential or hydrophobicity. Try every one of them on the same protein, the catalytic subunit of protein kinase A (1ATP), with ATP bound in the cleft between its two lobes:
Protein kinase A (1ATP, chain E) with ATP. Try each view and ask what you can and can't answer. The lines and sticks show every atom and hide the fold. Space-filling shows size and shape and hides everything inside, including the ATP. The trace and the cartoon show the chain's path, the β-sheet of the upper lobe, and the helical lower lobe, and they hide every side chain. The surface, colored by residue class (amber hydrophobic, aqua polar, blue positive, red negative, violet glycine, proline, and cysteine), shows the shape of the cleft and what lines its rim, and it hides the chain and the ATP inside.
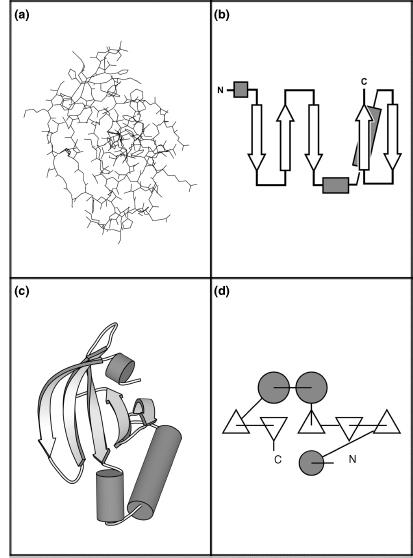
Open 1ATP in Mol*The N-terminal domain of protein kinase A is depicted below using four different representations. This section of the enzyme contains a five-stranded antiparallel β-sheet and three helices. Panel (a) depicts this domain using an all-atom line representation. Schematic diagrams replace the individual residues with shapes that represent the secondary structure they belong to and facilitate recognition of motifs and domains. Simple topology diagrams (b) are two-dimensional projections: β-strands are represented by arrows that point from the N-terminus to the C-terminus, α-helices by cylinders, and loops by lines. Cartoon diagrams (c) represent the three-dimensional structure as it actually occurs, with the atoms replaced by the same elements used in topology diagrams. TOPS diagrams (d) show both the topology and the interaction of structural elements in two dimensions: β-strands viewed edge-on are triangles and helices are circles.
Choosing a view starts from the question:
| Question | Representation | What it hides |
|---|---|---|
| What is the fold? Which strands pair? | cartoon or topology diagram | all side chains, and the real width of the chain |
| Do two homologs have the same backbone path? | Cα trace, superposed | side chains and everything that isn't Cα |
| Is this hydrogen bond's geometry plausible? | sticks or ball and stick, for a few residues | the overall fold, and the hydrogens unless added |
| How big is the protein; is that cavity open? | space-filling or a surface | the interior and the chain's path |
| What does a ligand see when it binds? | surface colored by property, ligand as sticks | everything below the surface; and the coloring is computed |
What the viewer adds
A good fraction of what a viewer draws isn't in the file.
The CPK color scheme was based upon the colors of the space-filling models developed by Corey and Pauling. In this scheme, carbon is light gray, nitrogen is light blue, oxygen is red, hydrogen is white, and sulfur is yellow. Many other color schemes can be used to highlight other features, such as atom types, a structural part of the molecule, or molecular properties (e.g., charge and polarity).
Single covalent bonds are usually represented as line segments or cylinders in models and can either be calculated by the molecular visualization program or generated directly from the CONECT records of the PDB file. The program compares the distance between two atoms with their radii, and if the distance is short enough, a bond is drawn between them. Double bonds are not usually represented in the PDB file, so the program also has to calculate these using the distances between atoms, since a single bond is longer than a double bond, which in turn is longer than a triple bond.
Hydrogen bonds are usually modeled, because they are a common interaction and have important roles in protein structure and function. Hydrogen bonds are calculated using bond angles, bond distances, and sometimes with reference to atom types. If two atoms are within particular bond distances and bond angles, then a dotted line is usually drawn to signify the bond. Molecular visualization applications may have different ways of determining and drawing the hydrogen bond.
Many protein structures solved by X-ray crystallography do not include hydrogens, because the resolution of the technique does not allow for definitive identification of the small hydrogen atom's location. Consequently, the molecular visualization program has to calculate the position of the hydrogen atom in the structure, based on the atom type: a classification of atoms by their chemical environments and bonding propensities, each with a defined geometry and number of bonded hydrogens.
A bond rule based on distance alone is easy to write and easy to fool. Here it is, run on the RNase A model that contains alternate conformations and on the hemoglobin model with its hemes:
import numpy as np
from primer import fetch

COVALENT_RADIUS = {"C": 0.76, "N": 0.71, "O": 0.66, "S": 1.05, "P": 1.07, "FE": 1.32}

def heavy_atoms(pdb_id):
    """(altloc, residue name, residue number, atom name, element, xyz, chain) for non-hydrogen, non-water atoms."""
    out = []
    for l in open(fetch(pdb_id)):
        if l.startswith(("ATOM", "HETATM")) and l[76:78].strip() != "H" and l[17:20] != "HOH":
            xyz = np.array([float(l[30:38]), float(l[38:46]), float(l[46:54])])
            out.append((l[16], l[17:20], int(l[22:26]), l[12:16].strip(), l[76:78].strip(), xyz, l[21]))
    return out

def guess_bonds(atoms, tolerance=0.4):
    """Bond any two atoms closer than the sum of their covalent radii plus a tolerance."""
    xyz = np.array([a[5] for a in atoms])
    radius = np.array([COVALENT_RADIUS.get(a[4], 0.8) for a in atoms])
    dist = np.linalg.norm(xyz[:, None] - xyz[None], axis=2)
    i, j = np.where(np.triu(dist < radius[:, None] + radius[None] + tolerance, k=1))
    return [(atoms[a], atoms[b], dist[a, b]) for a, b in zip(i, j)]

rnase = guess_bonds(heavy_atoms("7RSA"))
crossed = [(a, b, d) for a, b, d in rnase if {a[0], b[0]} == {"A", "B"}]
print(f"7RSA: {len(rnase)} bonds guessed, {len(crossed)} of them join conformation A to conformation B")
for a, b, d in crossed[:3]:
    print(f"   {a[1]} {a[2]} {a[3]} (altloc {a[0]})  –  {b[1]} {b[2]} {b[3]} (altloc {b[0]})  {d:.2f} Å")

iron = [(a, b, d) for a, b, d in guess_bonds(heavy_atoms("4HHB")) if "FE" in (a[4], b[4]) and "HIS" in (a[1], b[1])]
for a, b, d in iron:
    print(f"4HHB chain {a[6]}: bond drawn between {a[1]} {a[2]} {a[3]} and {b[1]} {b[2]} {b[3]} at {d:.2f} Å")
7RSA: 1106 bonds guessed, 78 of them join conformation A to conformation B
   GLN 11 CB (altloc A)  –  GLN 11 CB (altloc B)  0.12 Å
   GLN 11 CB (altloc A)  –  GLN 11 CG (altloc B)  1.43 Å
   GLN 11 CB (altloc B)  –  GLN 11 CG (altloc A)  1.41 Å
4HHB chain A: bond drawn between HIS 87 NE2 and HEM 142 FE at 2.14 Å
4HHB chain B: bond drawn between HIS 92 NE2 and HEM 148 FE at 2.22 Å
4HHB chain C: bond drawn between HIS 87 NE2 and HEM 142 FE at 2.26 Å
4HHB chain D: bond drawn between HIS 92 NE2 and HEM 148 FE at 1.98 Å
The 78 bonds between conformations A and B join two positions of the same side chain that never coexist in one molecule; a viewer that ignores the altloc column draws a tangle there. The iron–histidine "bonds" are metal coordination (a bond in which the histidine's nitrogen supplies both shared electrons to the iron), drawn or not depending on the program's rules. The same file can look different in two viewers, and neither picture is evidence for a bond the file never claimed.
The cartoon is computed too. Helix and strand boundaries come from the file's HELIX and SHEET records if the program trusts them, or from the program's own assignment from backbone hydrogen bonds (lesson 3.3), and two programs can disagree by a residue or two at every end. Surfaces depend on the radii and the probe chosen, and an electrostatic coloring depends on the charges someone assigned (lesson 1.3).
Viewing versus modeling
What is the difference between a molecular visualization program and a molecular modeling program? A molecular modeling program has the ability to construct, simulate, and predict molecular structures, properties, or functions. Modeling programs can measure and manipulate the geometry of the molecule's structure, calculate various molecular properties according to particular force fields, test various molecular conformations by performing energy minimizations, and compare structures. Some molecular visualization programs also have the ability to construct molecules and perform energy minimizations, so some visualization programs also support molecular modeling. However, the emphasis of a molecular visualization program is the visual representation of molecular structure and properties.
The test is whether the coordinates change in a way that changes the molecule. Rotating the view, or even rotating every coordinate in the file together, moves nothing relative to anything else. Turning one side chain about a bond does:
from primer import structure

def rotation(axis, degrees):
    """Rotation matrix about a unit axis through the origin (Rodrigues' formula)."""
    axis = axis / np.linalg.norm(axis)
    k = np.array([[0, -axis[2], axis[1]], [axis[2], 0, -axis[0]], [-axis[1], axis[0], 0]])
    t = np.radians(degrees)
    return np.eye(3) + np.sin(t) * k + (1 - np.cos(t)) * k @ k

ubq = structure("1UBQ")[0]["A"]
atoms = [a for a in ubq.get_atoms() if a.get_parent().id[0] == " "]
xyz = np.array([a.coord for a in atoms])
distances = lambda coords: np.linalg.norm(coords[:, None] - coords[None], axis=2)
before = distances(xyz)

spun = (xyz - xyz.mean(axis=0)) @ rotation(np.array([1.0, 2.0, 3.0]), 70).T
print(f"rotate the whole molecule by 70°: largest change in any interatomic distance {np.abs(distances(spun) - before).max():.4f} Å")

leu8 = ubq[8]   # rotate Leu 8's side chain beyond CB about the CA–CB bond: a change of its χ1 angle
ca, cb = leu8["CA"].coord, leu8["CB"].coord
moving = [i for i, a in enumerate(atoms) if a.get_parent() is leu8 and a.get_id() in ("CG", "CD1", "CD2")]
edited = xyz.copy()
edited[moving] = (xyz[moving] - cb) @ rotation(cb - ca, 120).T + cb
changed = np.abs(distances(edited) - before)
print(f"turn Leu 8's χ1 by 120°: largest change {changed.max():.2f} Å; "
      f"{(changed > 0.01).sum() // 2} atom pairs changed distance")
others = [i for i, a in enumerate(atoms) if a.get_parent() is not leu8]
before_close = distances(xyz)[moving][:, others].min()
after_close = distances(edited)[moving][:, others].min()
print(f"closest approach of Leu 8's CG, CD1, CD2 to other residues: {before_close:.2f} Å before, {after_close:.2f} Å after")
rotate the whole molecule by 70°: largest change in any interatomic distance 0.0000 Å
turn Leu 8's χ1 by 120°: largest change 4.08 Å; 1787 atom pairs changed distance
closest approach of Leu 8's CG, CD1, CD2 to other residues: 3.97 Å before, 3.68 Å after
(χ1, "chi one", is the first side-chain torsion angle, about the Cα–Cβ bond, defined the same way as φ and ψ in lesson 3.1.) The first operation is a change of view; the second makes a new model, one that was never observed and may put atoms into each other. Programs such as ChimeraX, PyMOL, and Mol* do both kinds of thing (mutate residues, pick rotamers, minimize energy, fit models into maps), and a file saved after a modeling step is a different model from the deposited one, even if the change looks small on screen.
Molecular visualization applications can contain errors and may interpret data in different ways. For example, one widely used program listed the number of polypeptide chains incorrectly, because it interpreted nonpolypeptide hetero groups as chains. Users may only choose the "default" parameters supplied by the software, without knowing how to adjust them or the effect such changes have on their results. Default parameters also differ between molecular visualization programs: choosing the default space-filling representation in one program can result in a completely different representation in another.
There is the danger of confusing the "image" with science. The user can also choose a particular molecular model, or rendering technique, based only on personal preference, and it is possible to use molecular visualization to inadvertently, or even deliberately, mislead the intended audience.
Trying it yourself
Every 3D view in this course has an "Open in Mol*" link to the full viewer. In Mol*, the Components panel switches representations, and the color themes include "Secondary Structure", "Hydrophobicity", and "Uncertainty/Disorder" (the B factor). In ChimeraX, the same moves are short commands:
open 1atp
hide atoms; show cartoons        # the fold
show :ATP atoms; style stick     # the ligand as sticks
surface                          # the solvent-excluded surface
color bfactor                    # color by B factor
open 1ubq
style sphere; show atoms         # space-filling
Check yourself
A figure shows a drug in a pocket with three dashed lines labeled "hydrogen bonds" to the protein. The structure is a 2.8 Å X-ray model with no hydrogens. What did the figure's author (or their software) decide, and what would you check in the file?
Reasoning
The software inferred the hydrogen bonds from donor–acceptor distances and perhaps angles, using its own cutoffs; the file has no hydrogens and no hydrogen-bond records for the drug. The protonation states behind the donor and acceptor labels were assumed too. Check the actual distances (about 2.6–3.3 Å between heavy atoms is typical), the occupancy and B factors of the drug and the residues involved, and whether the drug's density supports its orientation, since at 2.8 Å a flipped pose may fit nearly as well.
Which single representation would you choose to answer each question, and what could it mislead you about? (a) Do two kinases have the same arrangement of strands in their N-lobes? (b) Is the ATP pocket open to solvent in this conformation?
Reasoning
(a) A cartoon or a superposed Cα trace. It hides side chains, so two kinases with the same fold can differ completely in the residues that line the pocket, and the cartoon's strand ends depend on the program's assignment. (b) A molecular surface with the ligand shown as sticks. The surface depends on the probe radius and atomic radii; missing side chains (truncated at Cβ for lack of density) make a pocket look more open than it is, and a single model shows one conformation of a pocket that may breathe.
You open a deposited structure, use the program's "mutate" tool to change Leu 8 to Ala, minimize, and save. A colleague later uses your file as "the crystal structure." What is wrong, and what record keeping would prevent it?
Reasoning
The saved file is a model you built, not the deposited experimental model: Leu 8 was never observed as alanine, and minimization moved other atoms to positions no data supports. The coordinates look like the original's in format and mostly in content, so nothing in the file flags the difference. Keep the deposited file unchanged, name derived files to say what was done, and record the operations (or use a format field such as a REMARK or mmCIF category for the provenance).